The problem
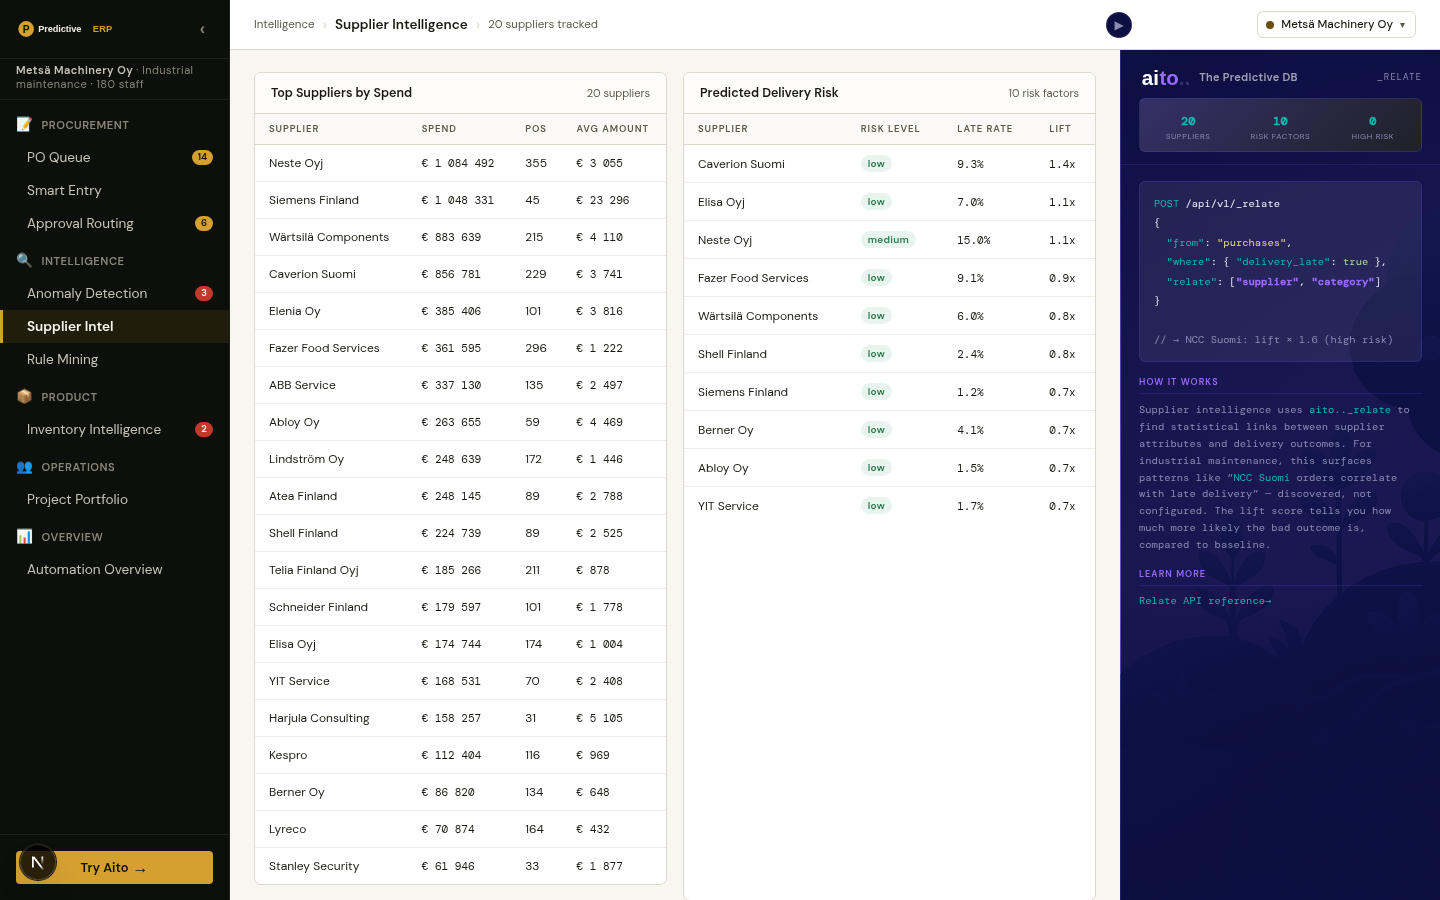
Procurement teams know their top 20 suppliers by spend. The next 80 are a blur. Yet the 80 hold the patterns that matter: which suppliers are concentrating risk, which are quietly raising prices, which deliver late more often than the average, which are introduced by which buyers. The data shows it all; the team is too thin to mine it.
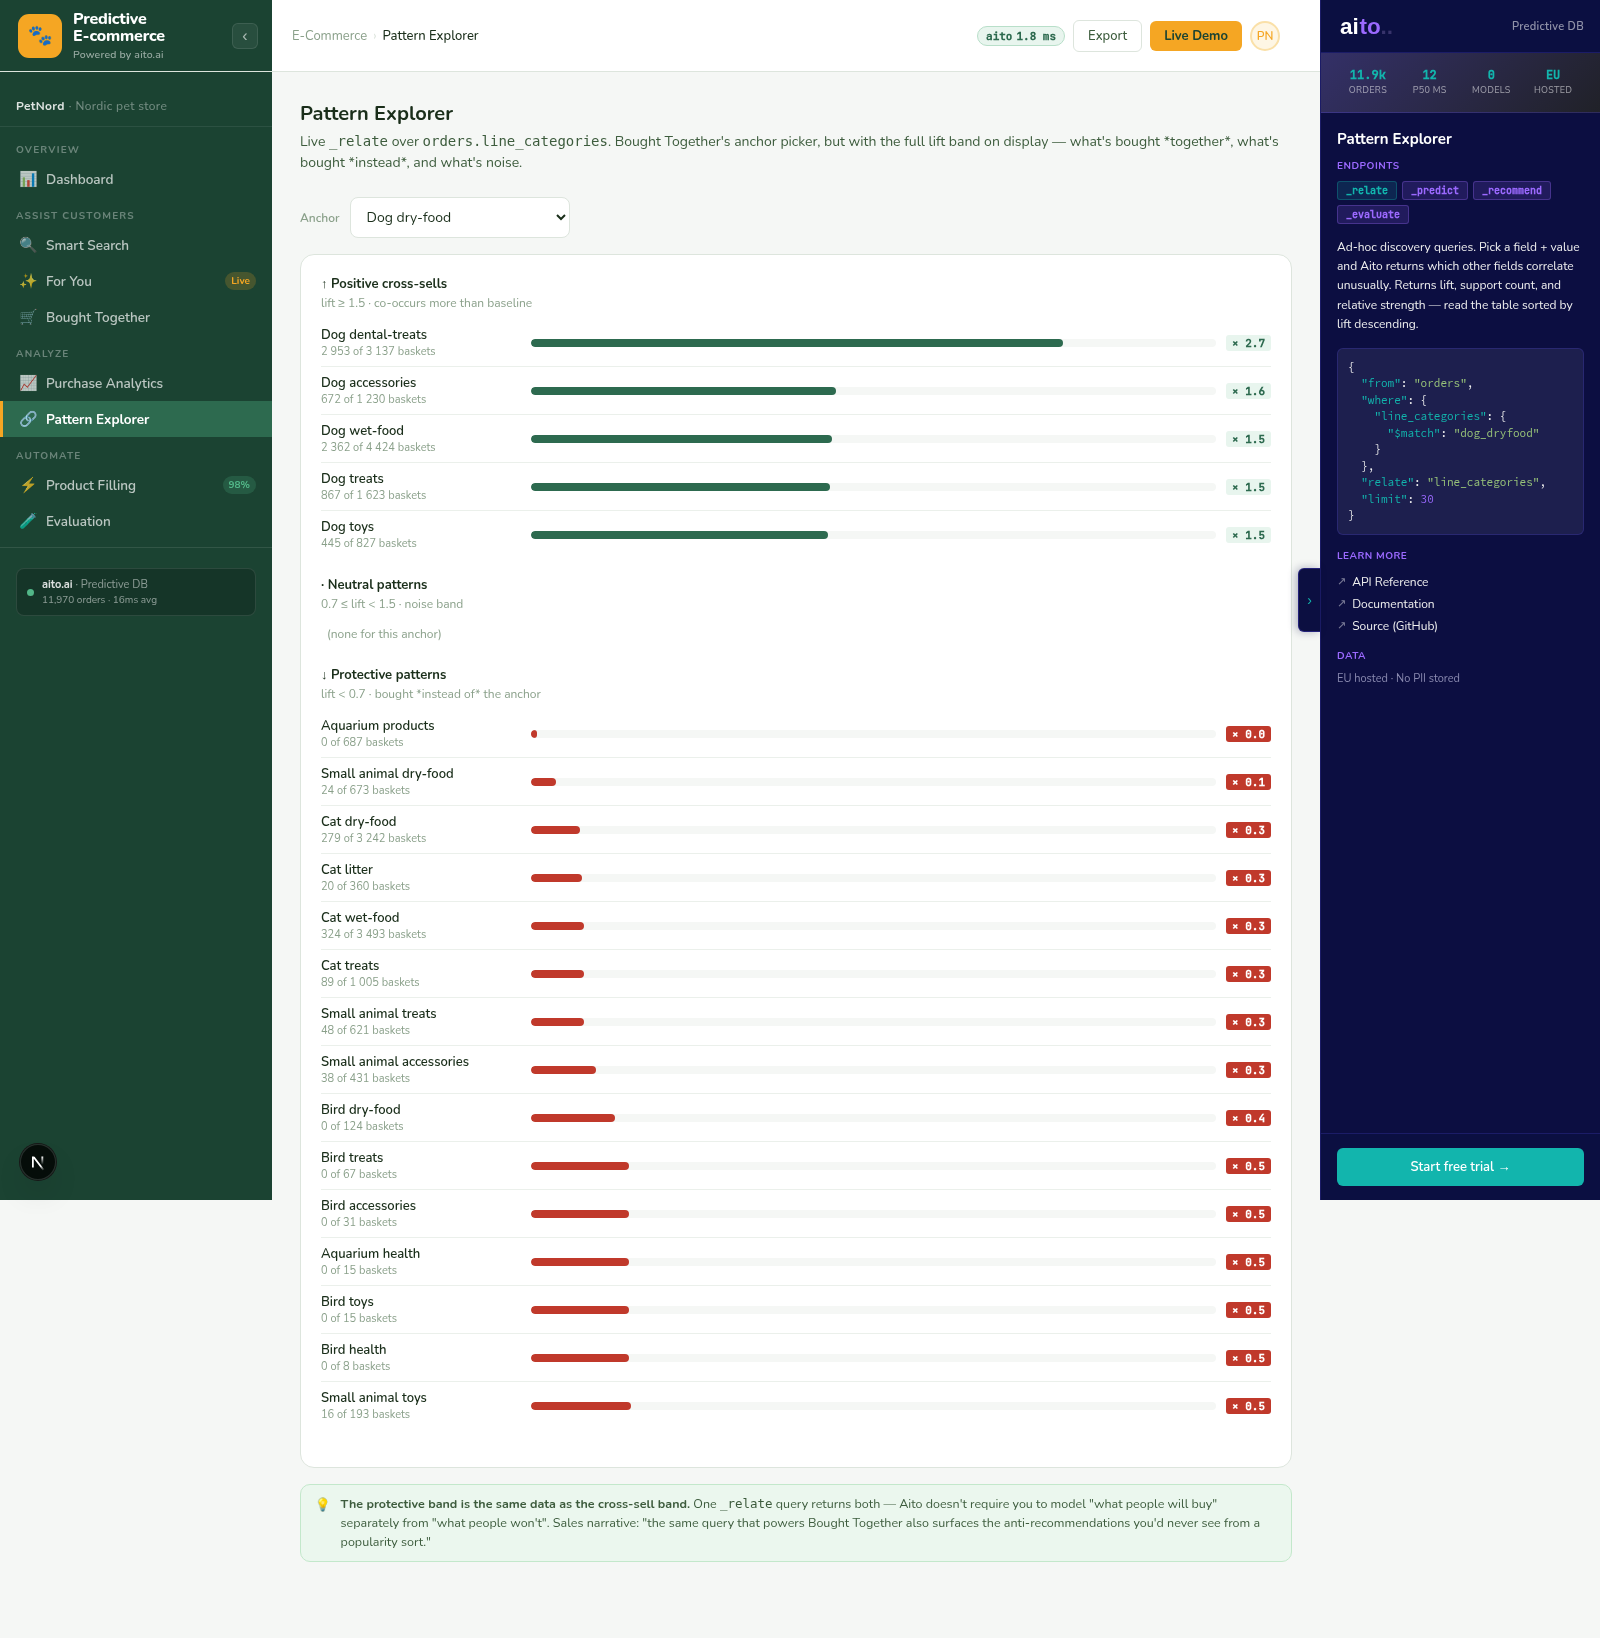
Supplier intelligence is the discovery layer that turns the transaction history into actionable supplier insights. Spend leaderboard with anomalies highlighted. Delivery-risk discovery via _relate. Concentration risk by category. New-supplier introduction patterns. All mined live from the existing PO and invoice tables.
How it works
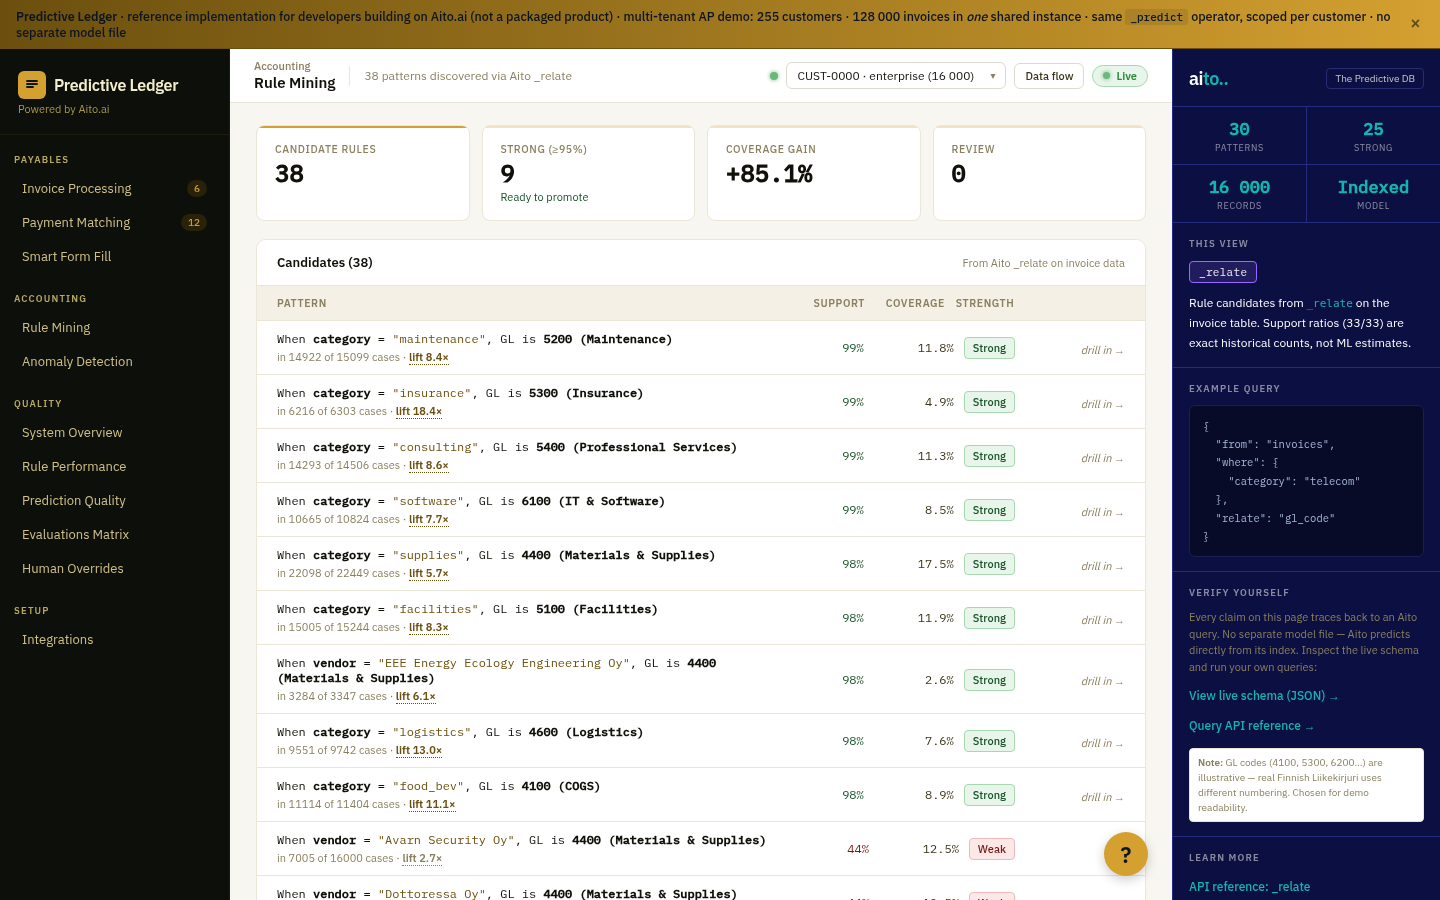
_relate runs the conditional probability between supplier and any other attribute — late_delivery, price_variance, category_concentration, introducer. For "which suppliers are disproportionately late?", the query asks _relate(supplier, late_delivery) ranked by lift. Suppliers with lift >2× and support >20 deliveries surface as actionable; suppliers with lift <1.5× are within normal variance.
The spend leaderboard composes _predict (total_spend) with _relate (supplier × category × variance). The result is a single view: top suppliers by spend, with the categories driving the spend, the variance from the predicted band, and the late-delivery lift. The procurement lead opens the view once a month and sees the top 20 actionable supplier patterns ranked.
{
  "from": "deliveries",
  "where": {
    "period": "last_quarter",
    "late": true
  },
  "relate": "supplier",
  "select": ["$lift", "$p", "$support", "supplier"],
  "limit": 20
}
For the full architecture, see the technology overview. For the broader narrative across multiple use cases, read The Predictive Application.
See it live
This use case runs in the 📋 ERP demo today. Click through to the live application and inspect the queries that produce the result. Source is on GitHub under Apache 2.0.
Frequently asked
How is this different from a standard spend-analytics tool (Coupa, Jaggaer)?
Standard spend tools have rich dashboards and category taxonomies. _relate is the discovery primitive that surfaces patterns those dashboards do not pre-aggregate. The two are complementary — use a spend tool for known metrics, use _relate to find the patterns nobody named yet.
How far back can the lift analysis look?
As far back as the data goes. Mature deployments commonly look at trailing 12 months for stable patterns and trailing 90 days for active anomaly detection. Older data dilutes recent shifts; younger data has higher variance.
Can supplier intel feed into the PO routing prediction?
Yes. High-risk supplier flags can join the where clause of the PO routing prediction; the prediction conditions on the risk signal automatically. "For high-risk suppliers, route to CFO" becomes a rule mined from the data rather than authored manually.
Does this handle multi-currency, multi-region supplier networks?
Yes. Conditional probability is independent of currency once you condition on it. Add the currency or region to the where clause; the lift analysis scopes to that subset. Multi-region tracking is one query per region, ranked side-by-side.
How does the prediction handle supplier consolidations or rebrands?
Supplier mergers and rebrands need a master-data update to merge the historical IDs. Once merged, the conditional probability is computed over the unified history. Before merging, the system sees them as separate suppliers with separate patterns.