The problem
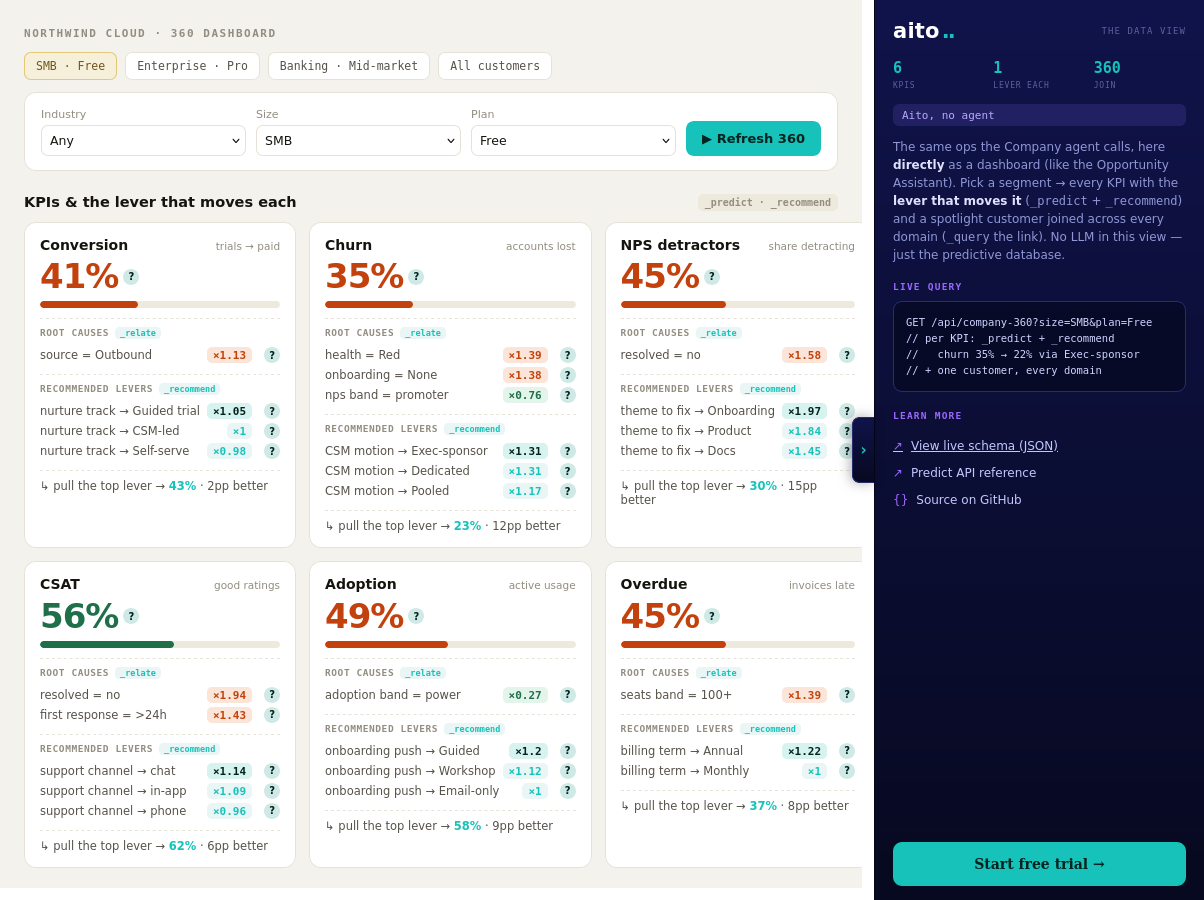
Lift is the most useful statistical primitive nobody puts on dashboards. Lift = conditional probability / baseline probability. A lift of 5× means "this thing happens five times more often when that condition is true." Once you have it, half the business analytics questions you didn't know how to ask become answerable.
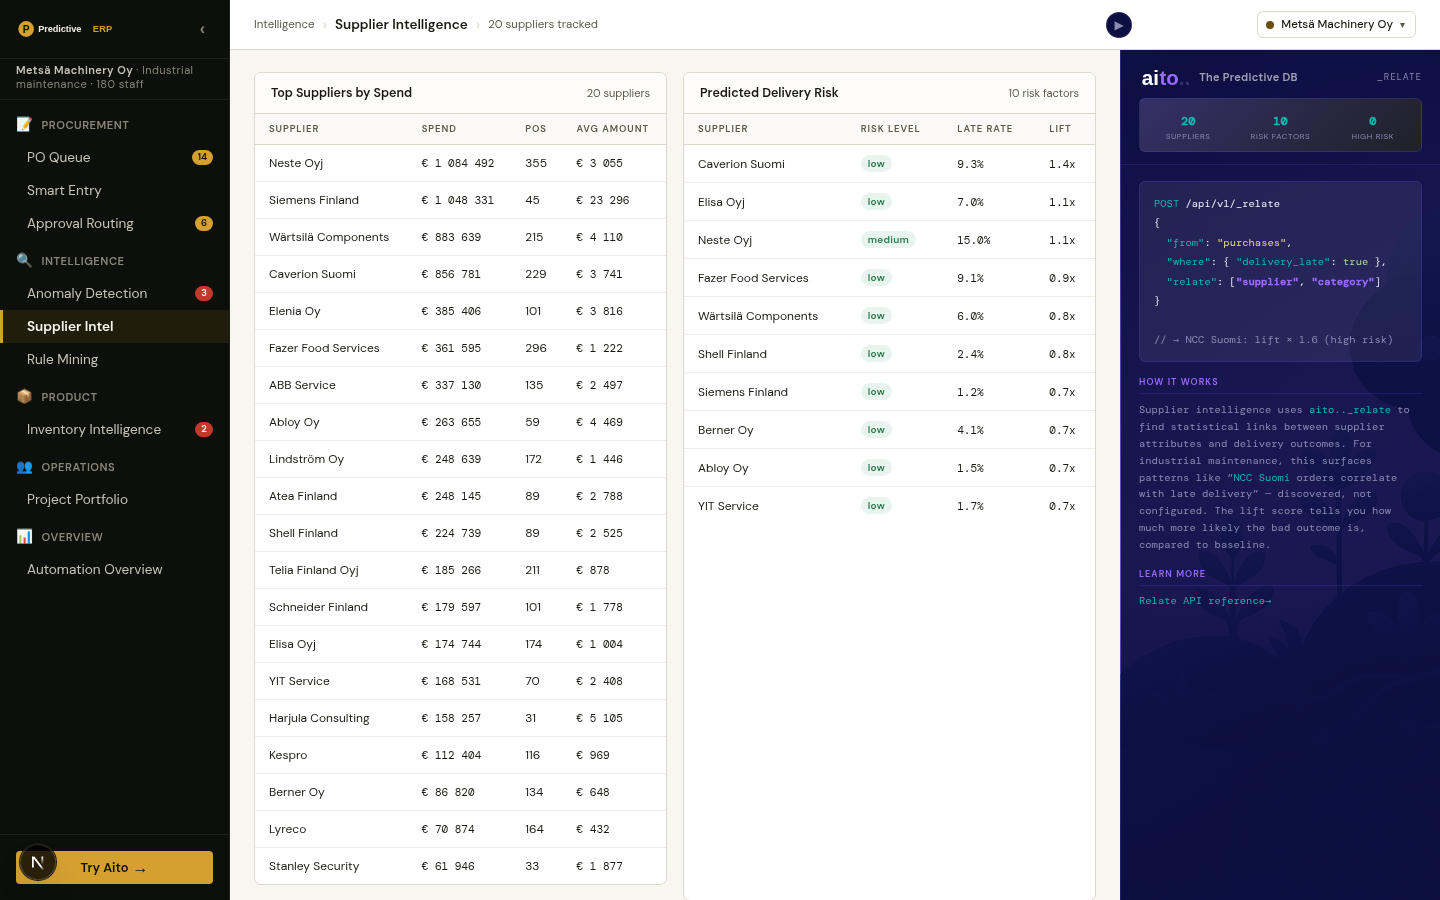
"Are customers in segment X more likely to convert on plan Y?" Lift. "Do invoices from supplier X spike in Q4?" Lift. "Does feature Y correlate with churn for segment Z?" Lift. The traditional way to compute it is custom SQL or a Python notebook; the cost of that path is why most teams never run the analysis. Pre-baked dashboards don't have it because lift requires picking two attributes the dashboard didn't anticipate.
How it works
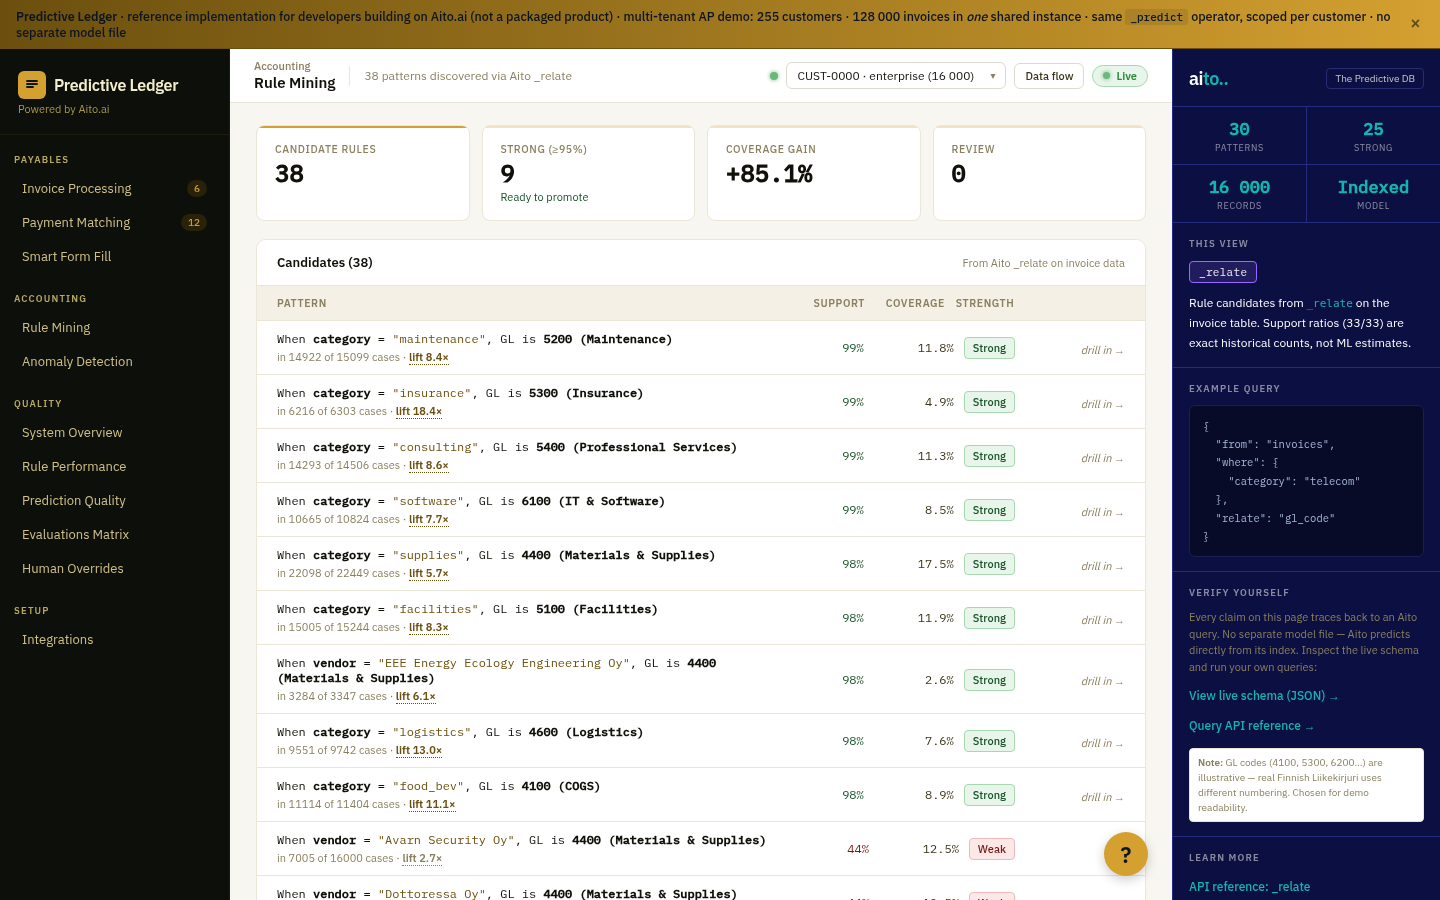
_relate computes conditional lift between any two attributes in the operational data. The query specifies the anchor attribute (the thing you're conditioning on) and the related attribute (the thing whose probability you want under that condition). The result is lift, support, and conditional probability — ordered by statistical significance.
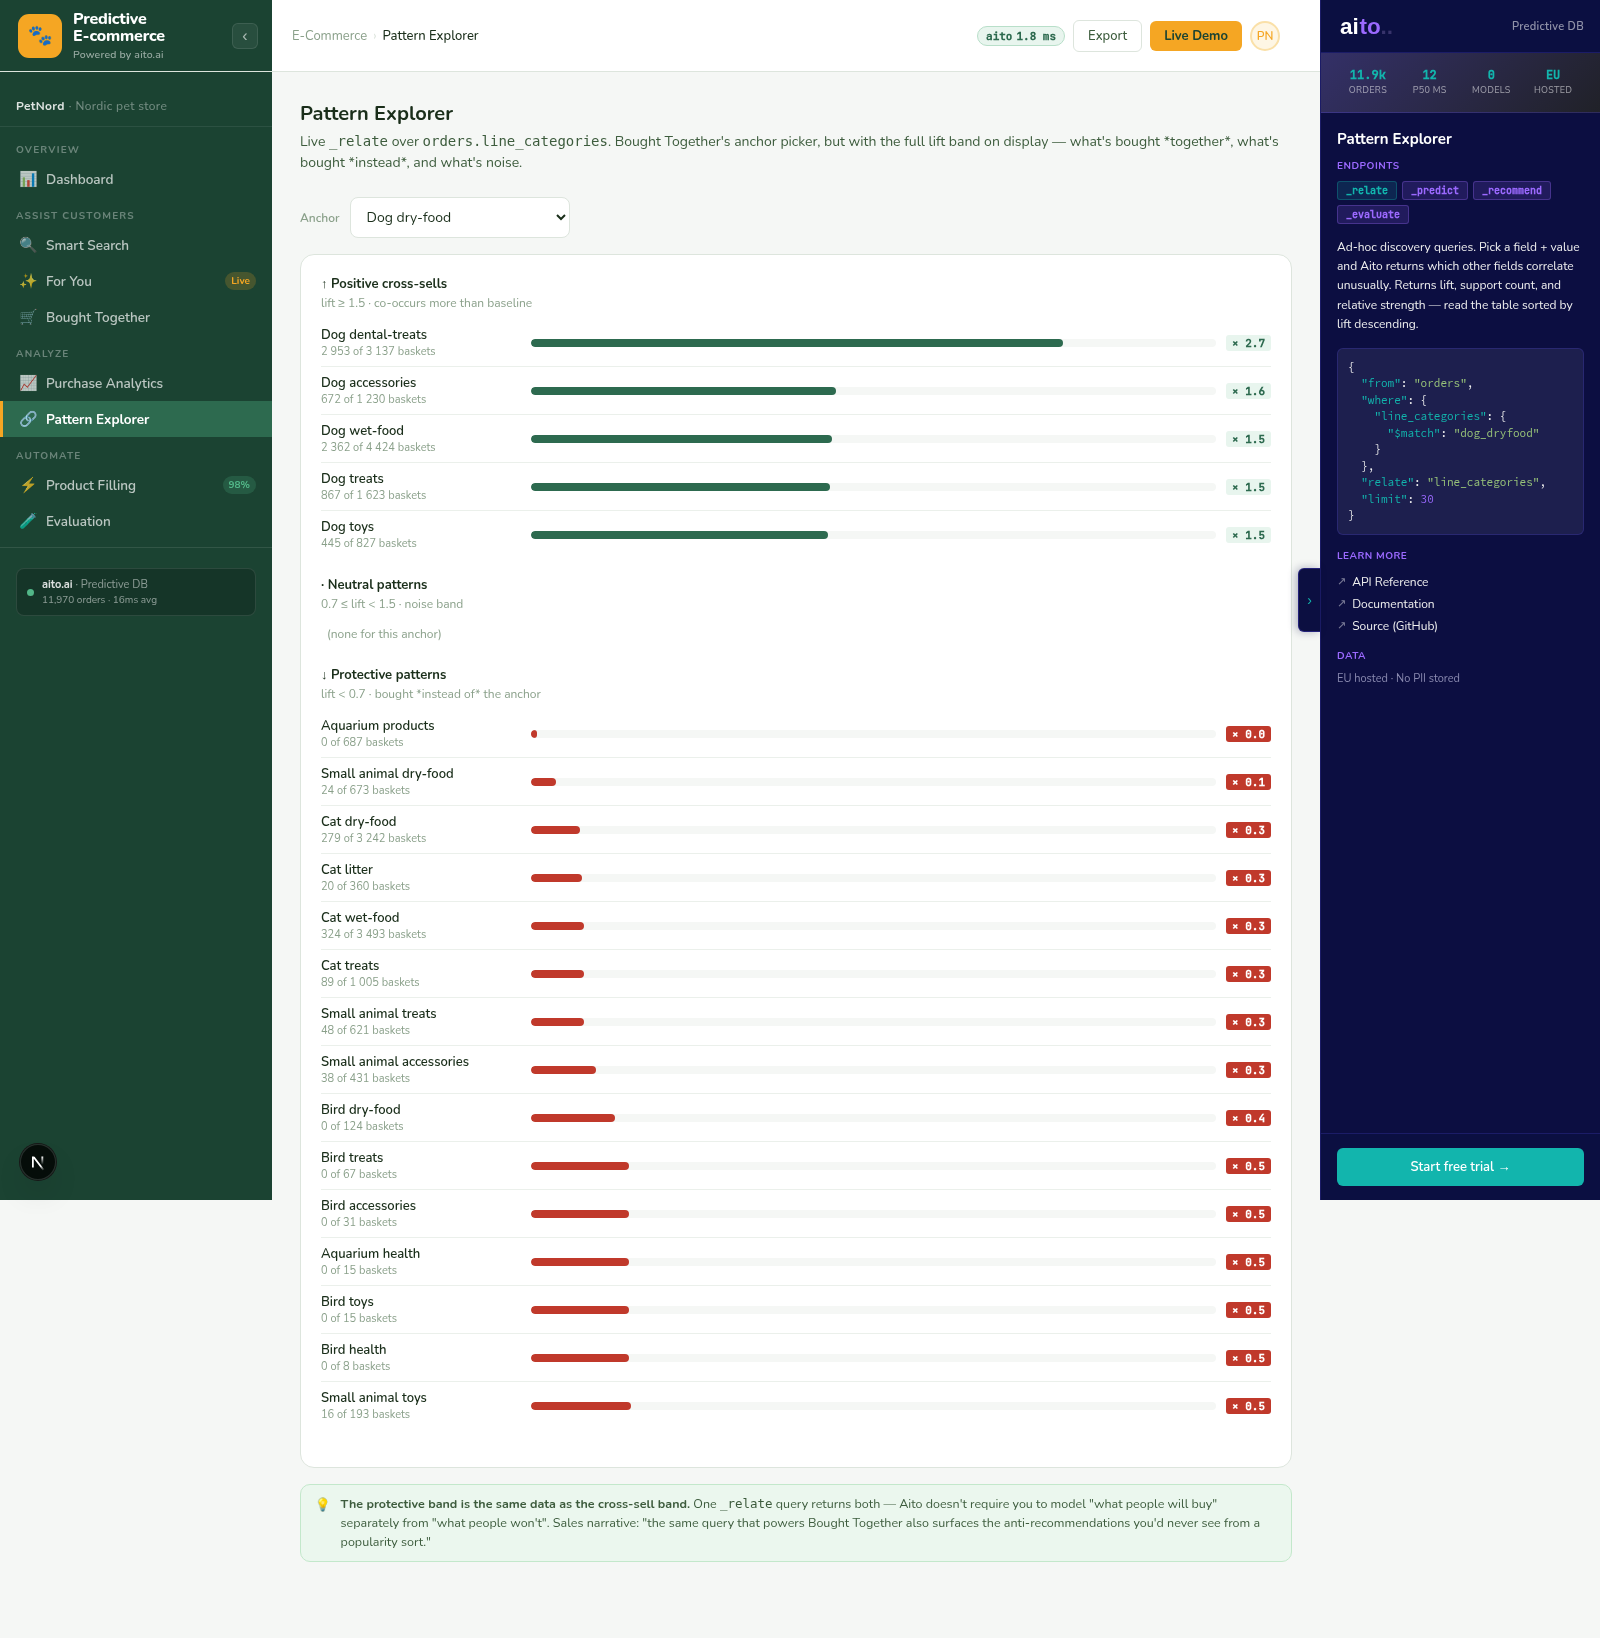
Lift composes. Lift > 5× and support > 20 is the typical actionable threshold. Lift >10× with high support is usually a real signal worth turning into a rule, a recommendation, or a tracked metric. Lift below ~3× is noise; lift above ~10× with low support is suspicious (small-N artefacts).
{
  "from": "impressions",
  "where": {
    "customer_segment": "enterprise"
  },
  "relate": "product.category",
  "select": ["$lift", "$p", "$support", "product.category"],
  "limit": 10
}
For the full architecture, see the technology overview. For the broader narrative across multiple use cases, read The Predictive Application.
See it live
This use case runs in the 🛒 E-commerce demo today. Click through to the live application and inspect the queries that produce the result. Source is on GitHub under Apache 2.0.
Frequently asked
What is the difference between lift and correlation coefficient?
Correlation measures linear association between numeric variables. Lift measures conditional probability ratio between categorical attributes. The two answer different questions. For "customers in this segment are 5× more likely to buy this category," lift is the right primitive; correlation does not apply.
How do we use lift for cohort analysis?
Lift IS the cohort-analysis primitive. "Cohort X has Y times higher rate of behaviour Z than the baseline." Run _relate with cohort as the anchor and behaviour as the related attribute; the lift tells the story directly.
Can lift be used for fraud or anomaly detection?
Yes — high-lift patterns where the human knows the pattern should NOT exist are anomalies worth investigating. "Supplier X has lift 8× for late delivery in Q4" is a delivery anomaly; "Vendor Y has lift 5× for amount outside predicted band" is a pricing anomaly.
Is lift the same as the metric used in Bayesian recommenders?
Lift is the underlying primitive in many recommender systems — including Aito's. The Bought Together view runs _relate ranked by lift. The cross-sell recommendation IS the high-lift pattern.
How does lift handle low-support patterns (lift looks big but on few observations)?
The query filters by minimum support. Without that filter, a pattern with lift 50× on 2 observations is statistically meaningless. The standard filter is support >= 20-50 observations depending on the underlying volume. The dashboard surfaces both lift and support so the user can judge.