The problem
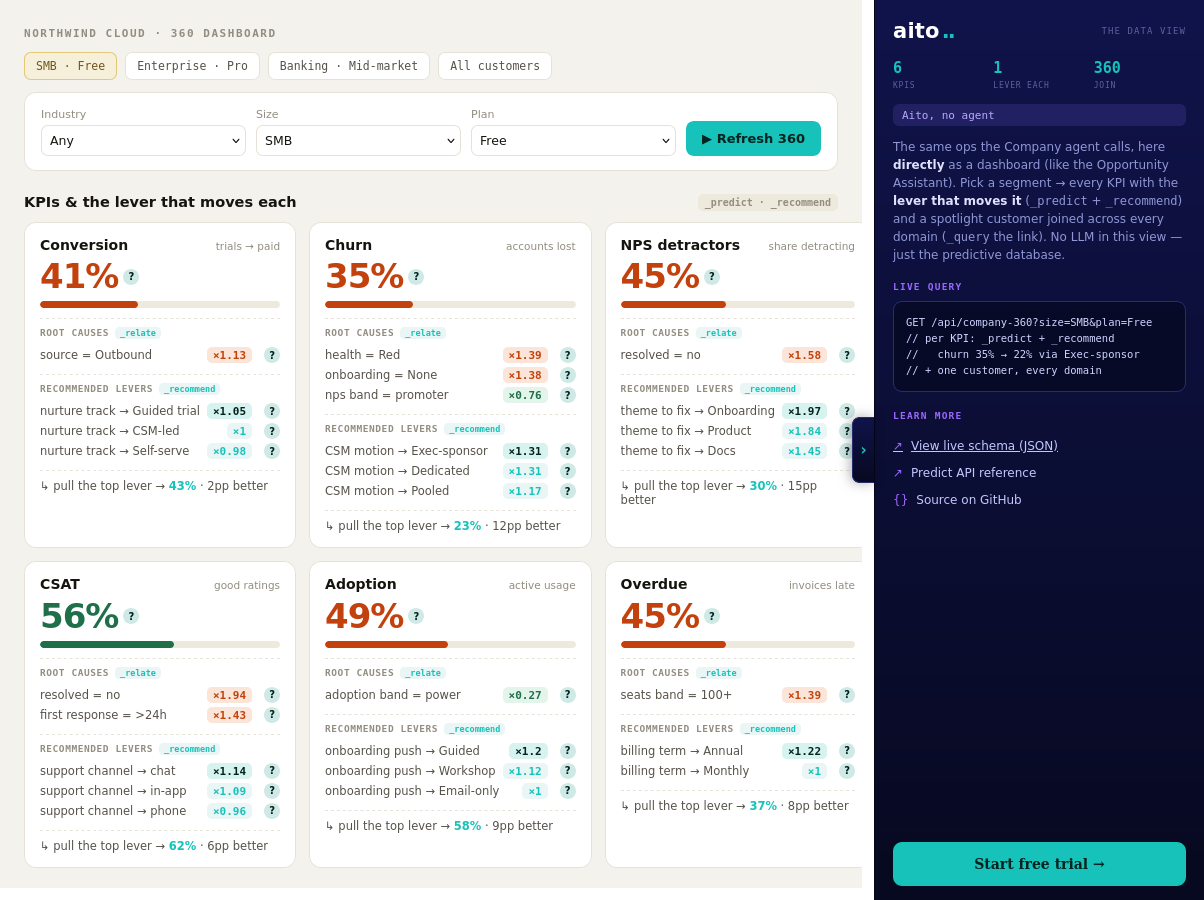
Patterns hide in operational data in two forms: statistically discoverable (you can find them by running an analysis) and predictive (you can use them to predict the next event). Most BI tools surface the first kind — show me which categories co-occur, which customer segments correlate, which products are bought together. Few tools surface the second kind cleanly, because that requires a predictive operator running over the same data.
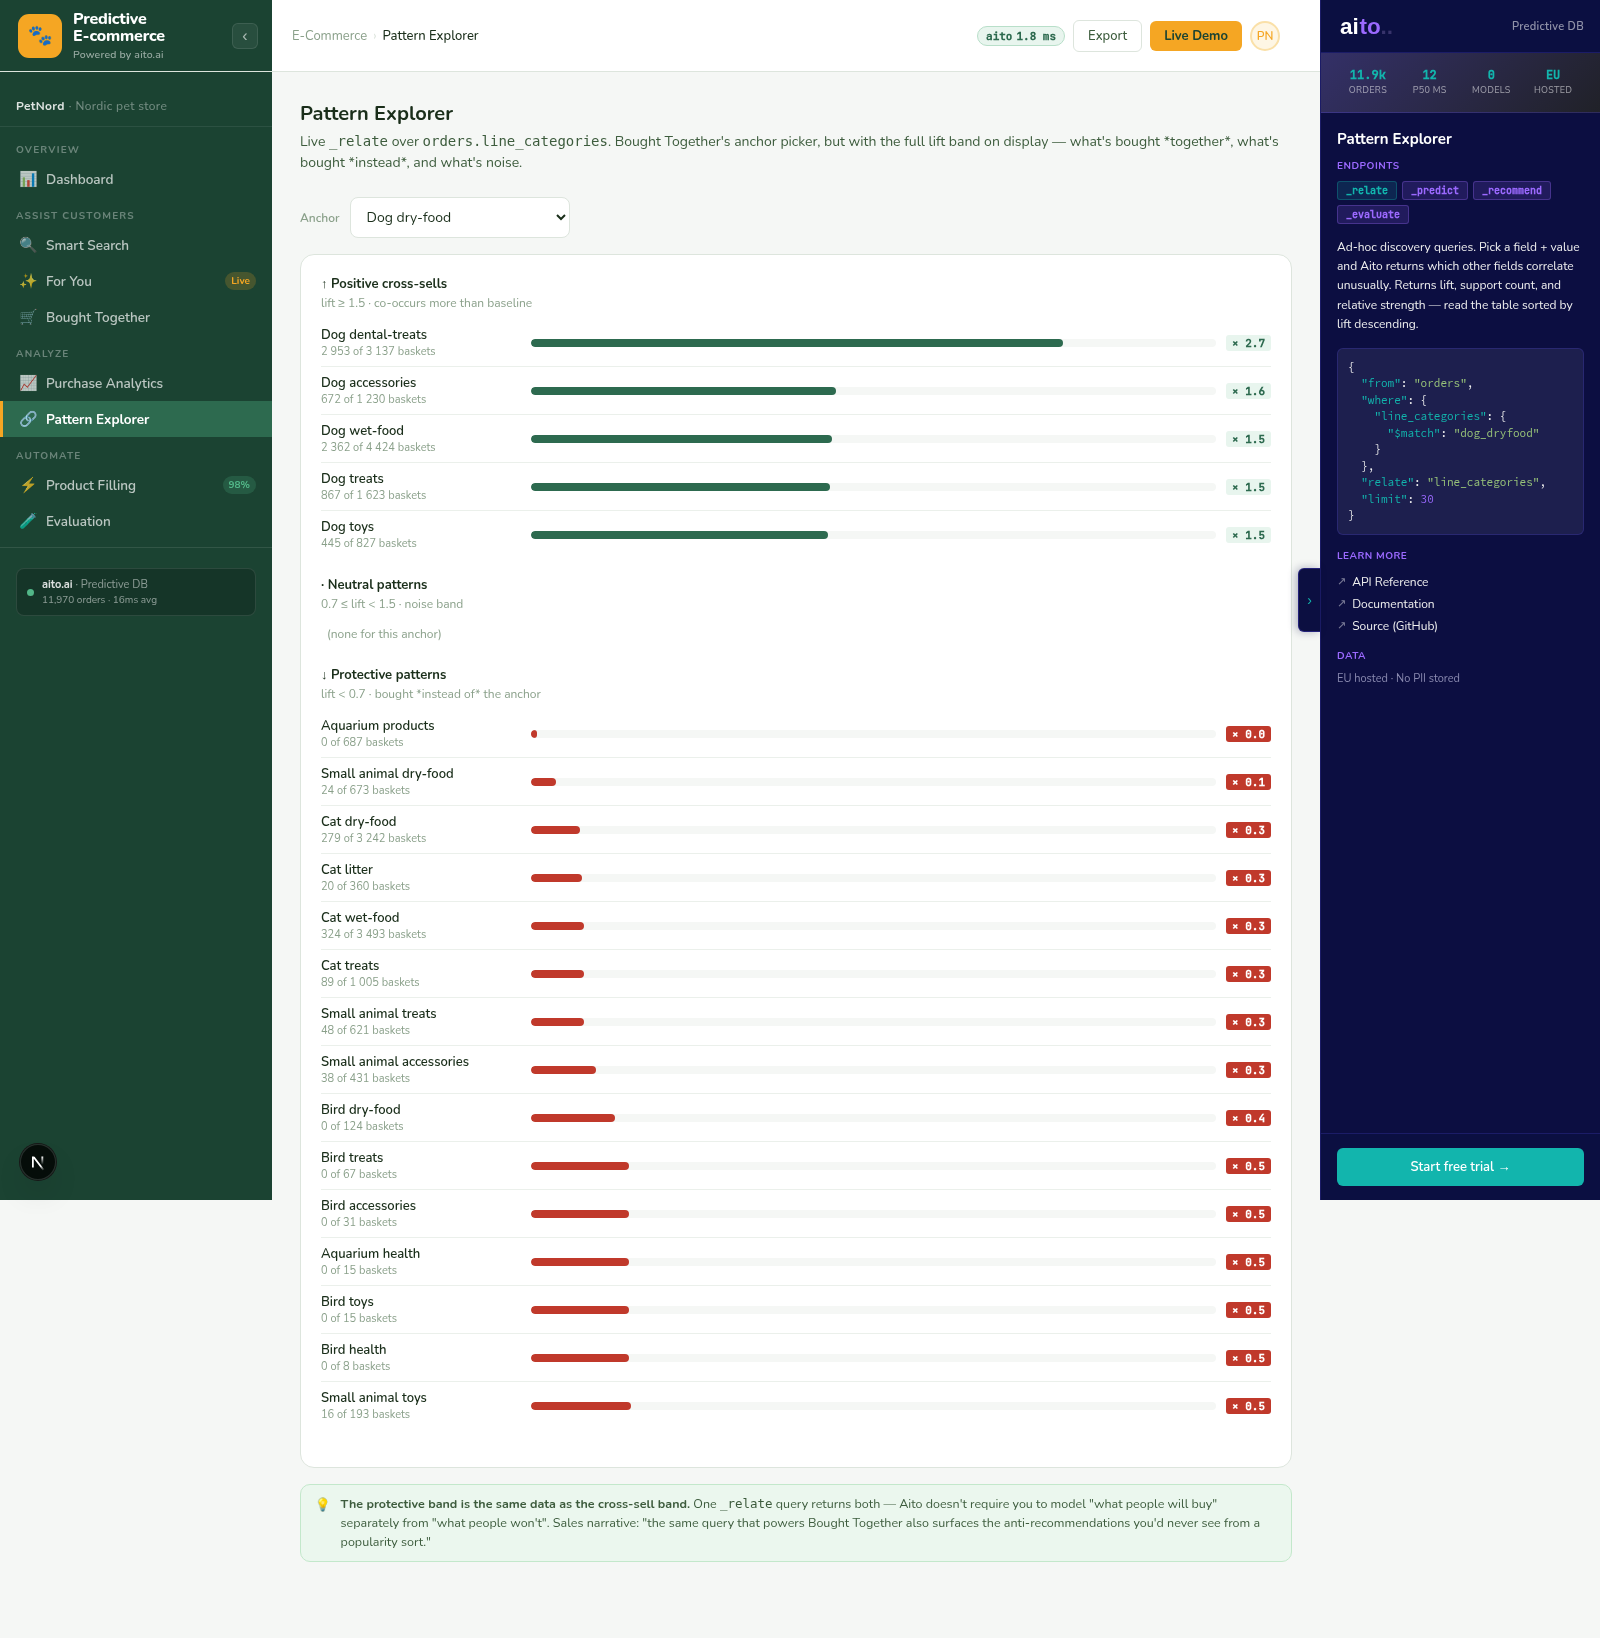
The Pattern Explorer view in the e-commerce demo surfaces both at once. For any anchor (a product category, a customer segment, a time window), the system returns the related attributes ranked by lift: which products are bought together, which segments have which preferences, which seasonalities apply. Each pattern can be inspected, exported as a rule, or used as the input to a downstream prediction.
How it works
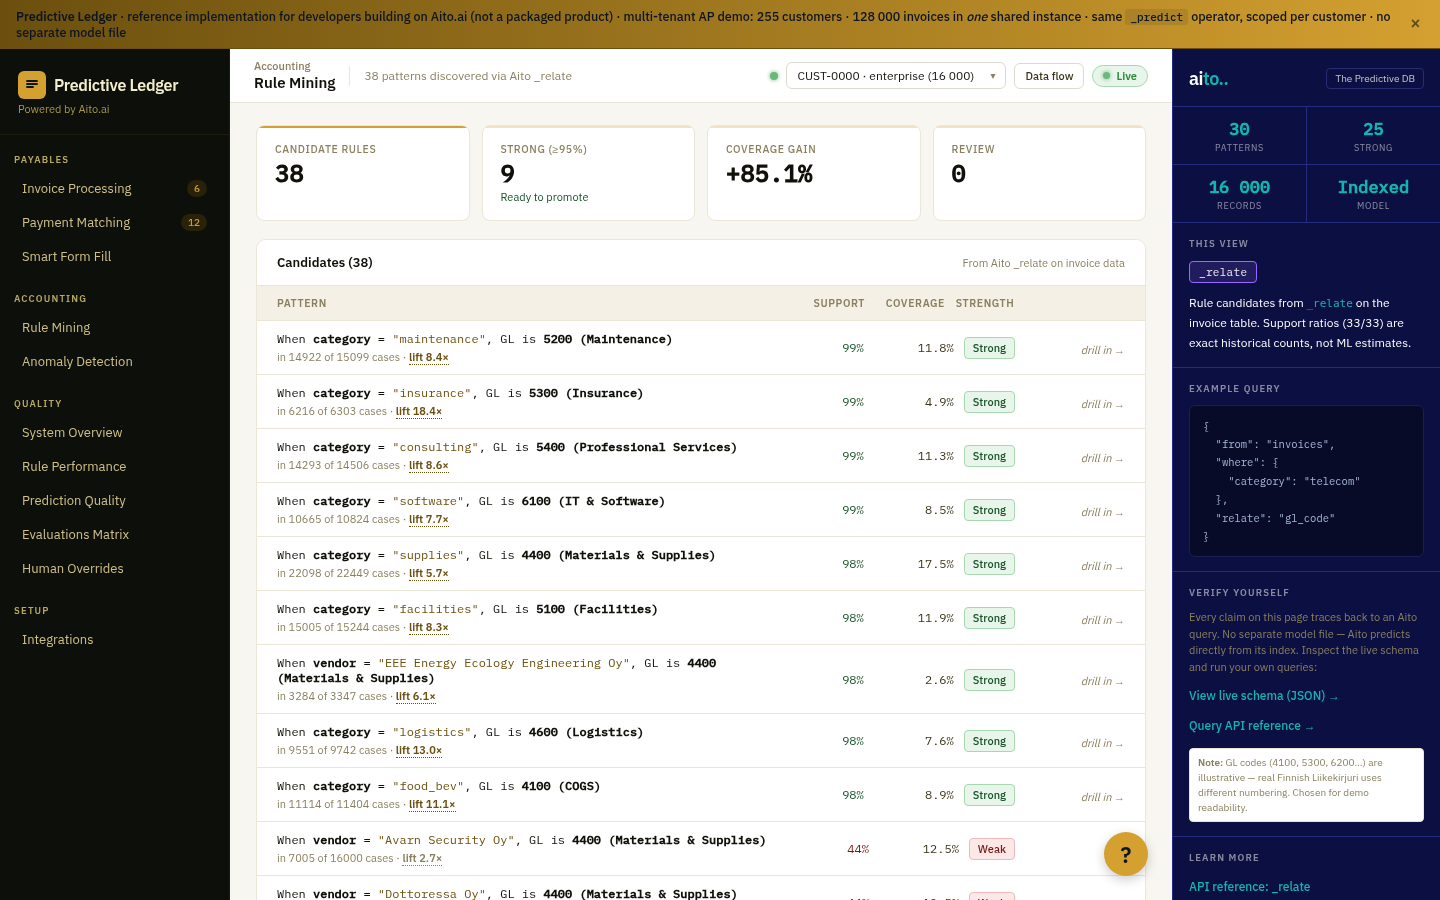
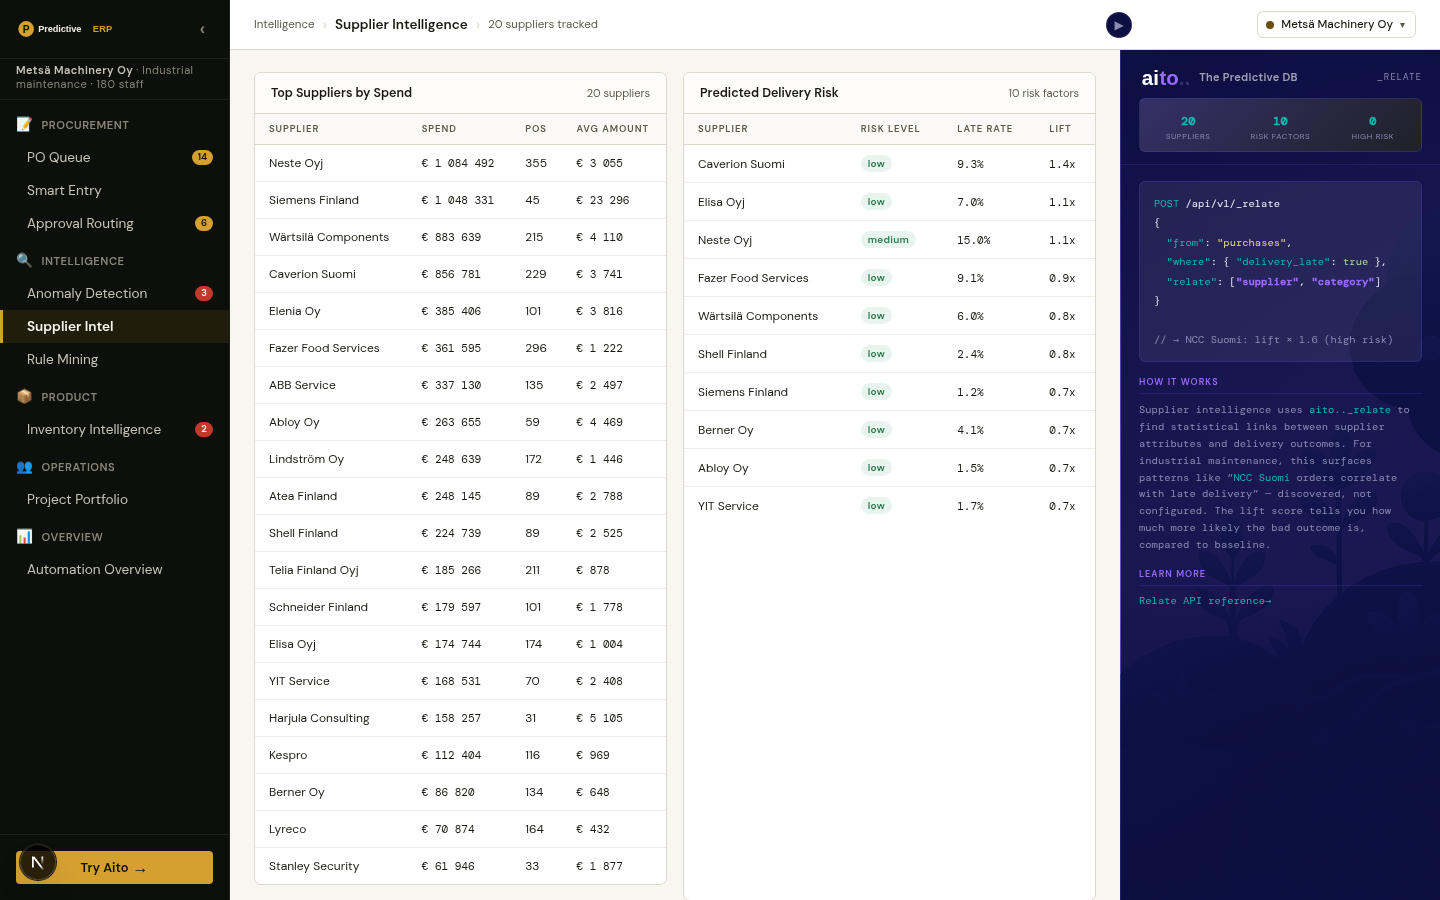
_relate runs the conditional probability between any two attributes. The pattern-explorer query asks "for anchor X, what are the top-N related attributes Y ranked by lift?" The result is ordered by statistical significance, filtered by minimum support, and decorated with $why so the user can see the underlying counts. Lift of 5× and above is the typical "worth a look" threshold; lift of 10× and above is usually a real pattern.
The exploration is interactive. Pick a pattern that looks promising, drill in to see the underlying observations, then either promote it to a rule (drops to the Rule Mining workflow), use it as a recommendation seed, or save it as a tracked metric. Every action records an audit trail so the pattern's origin is recoverable later.
{
  "from": "order_lines",
  "where": {
    "product.category": "dog-dryfood",
    "$lift": { "$gte": 2 }
  },
  "relate": "product.category",
  "select": ["$lift", "$p", "$support", "product.category"],
  "limit": 15
}
For the full architecture, see the technology overview. For the broader narrative across multiple use cases, read The Predictive Application.
See it live
This use case runs in the 🛒 E-commerce demo today. Click through to the live application and inspect the queries that produce the result. Source is on GitHub under Apache 2.0.
Frequently asked
How is this different from a typical analytics dashboard?
Analytics dashboards show pre-aggregated metrics — total sales, churn rate, average order value. Pattern Explorer surfaces the conditional relationships in the data — which attributes correlate, which segments behave differently, which combinations co-occur. Dashboards answer "what happened?"; Pattern Explorer answers "what patterns exist that I have not named yet?"
Does this surface causation or just correlation?
Correlation, ranked by statistical significance (lift × support). The system does not claim causation; it surfaces patterns worth investigating. The user (or downstream causal analysis) determines whether a pattern reflects causation or some other mechanism. For most operational questions ("are these patterns real and stable enough to act on?"), correlation at high lift × high support is what matters.
How do we avoid information overload from many patterns?
Three filters do the work: minimum lift (typically 3-5×), minimum support (typically 20+ observations), and a relevance ranking. The top-20 patterns surfaced at lift ≥ 5 and support ≥ 20 is usually a manageable list. Filtering tighter (lift ≥ 10) gives a high-confidence shortlist for action; filtering looser (lift ≥ 2) shows a broader exploration view.
Can the patterns be exported to other tools (Tableau, Looker)?
Yes — the _relate query returns JSON; the result is exportable to any analytics tool that accepts JSON. The typical pattern is: Pattern Explorer surfaces the discovery; the team picks a pattern to track; the metric goes into the BI dashboard for ongoing monitoring. Aito stays in the discovery role; the BI tool handles the dashboard.
What is the difference between Pattern Explorer and Rule Mining?
Pattern Explorer is the discovery surface — wide, exploratory, no expected action. Rule Mining is the workflow that turns discovered patterns into authored rules — focused, decision-oriented, with promote/dismiss/override actions. The two share the same underlying _relate operator; they differ in the UI and the workflow on top.