The problem
Operational ML systems need an operational dashboard. "Is the prediction working today, on the data flowing right now, at the confidence tiers we're auto-processing?" If the dashboard says yes, the team trusts the automation. If it says no — or if there's no dashboard at all — the team either over-trusts and produces silent errors, or under-trusts and misses the automation gains.
The dashboard isn't optional in a confidence-tiered automation system. It's the safety mechanism that makes the tiering credible. "At 95% confidence, error rate is 1.2%, sample size 4,800 over the last 7 days" — that's the answer the dashboard needs to give for every field the system predicts on.
How it works
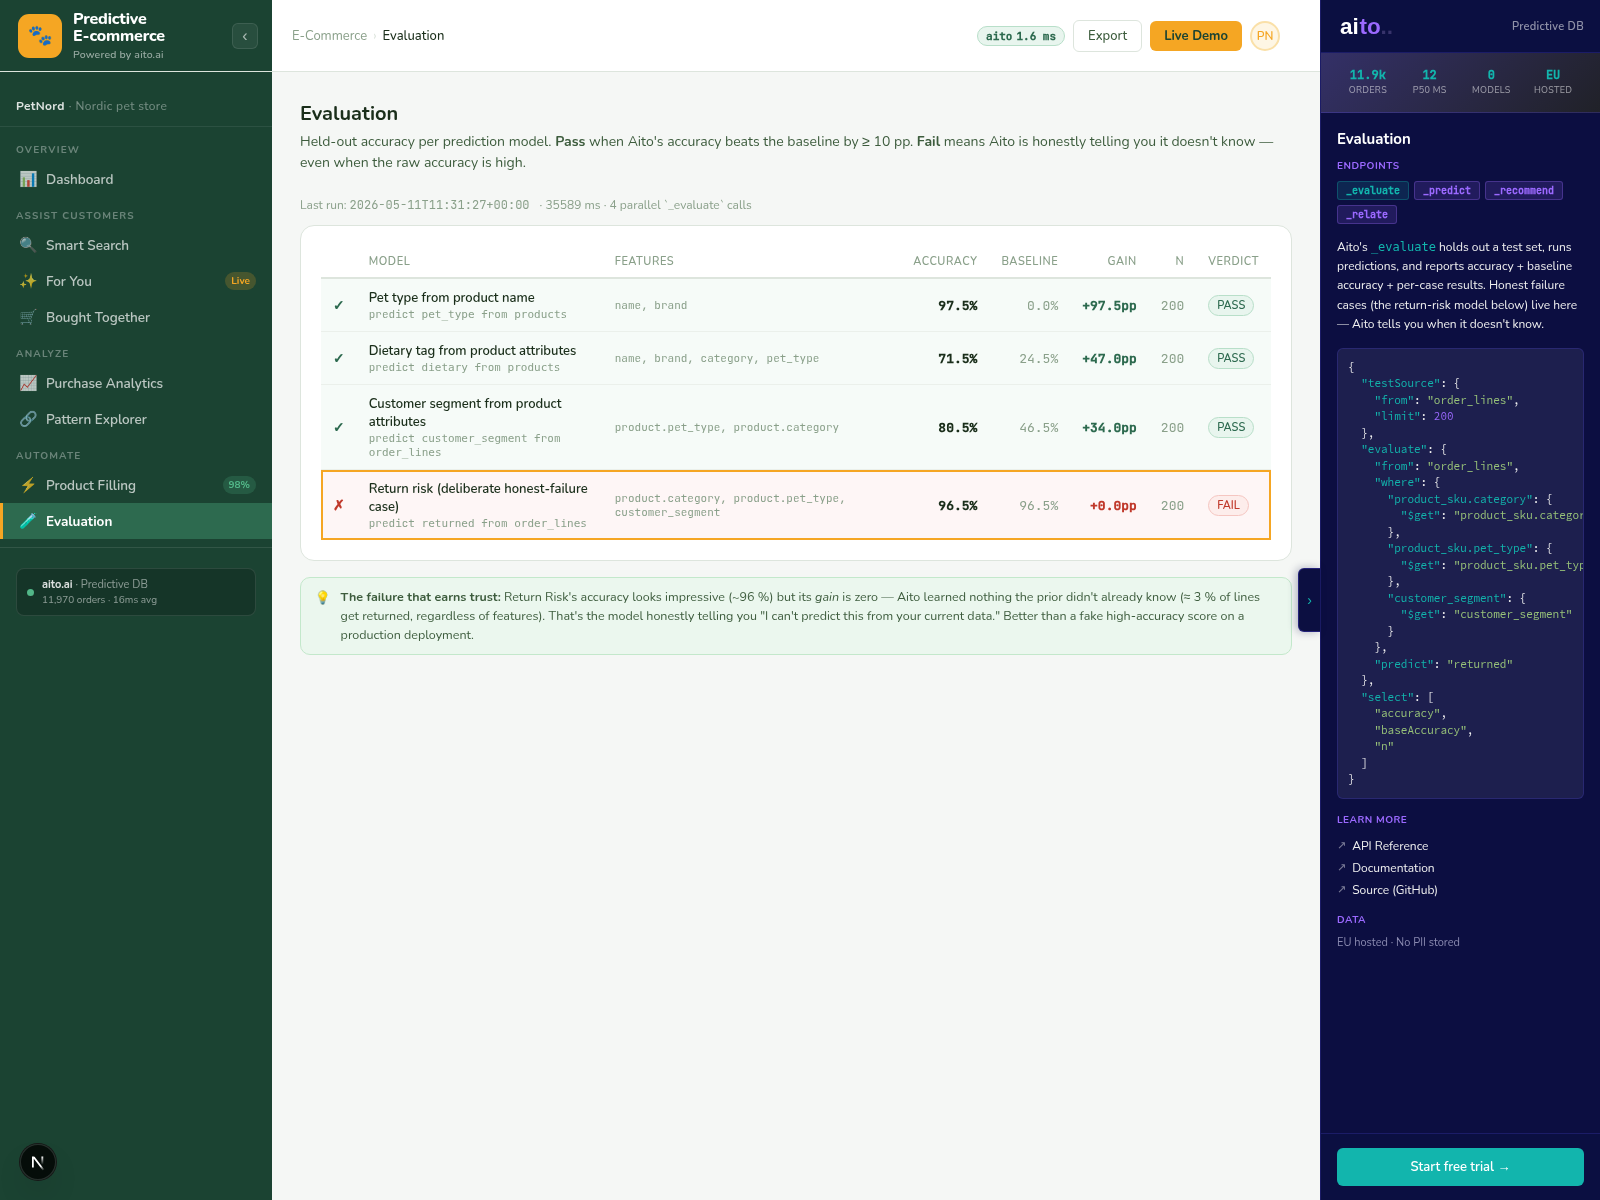
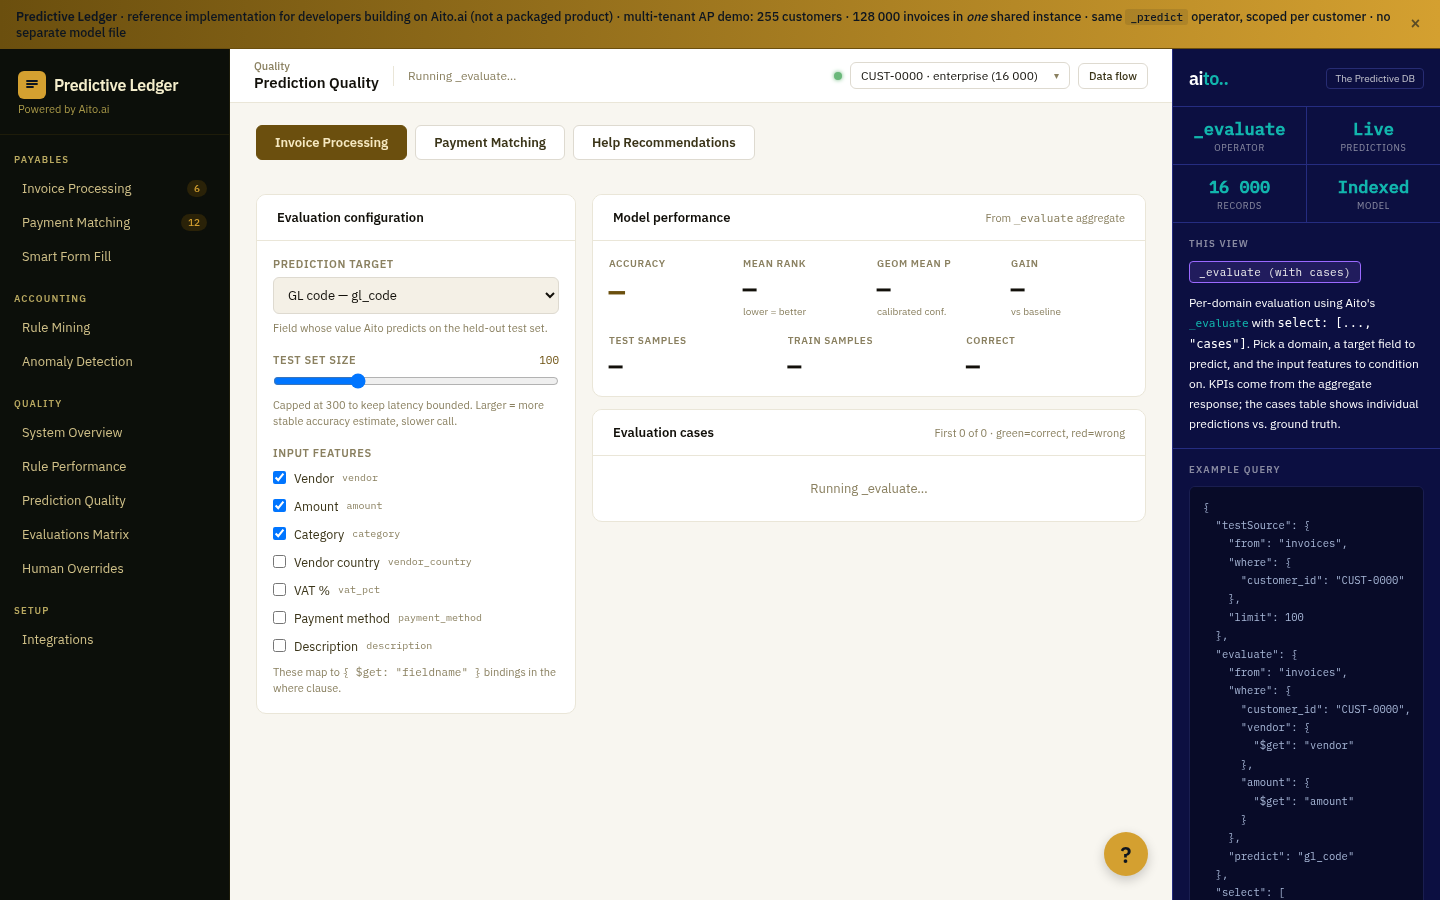
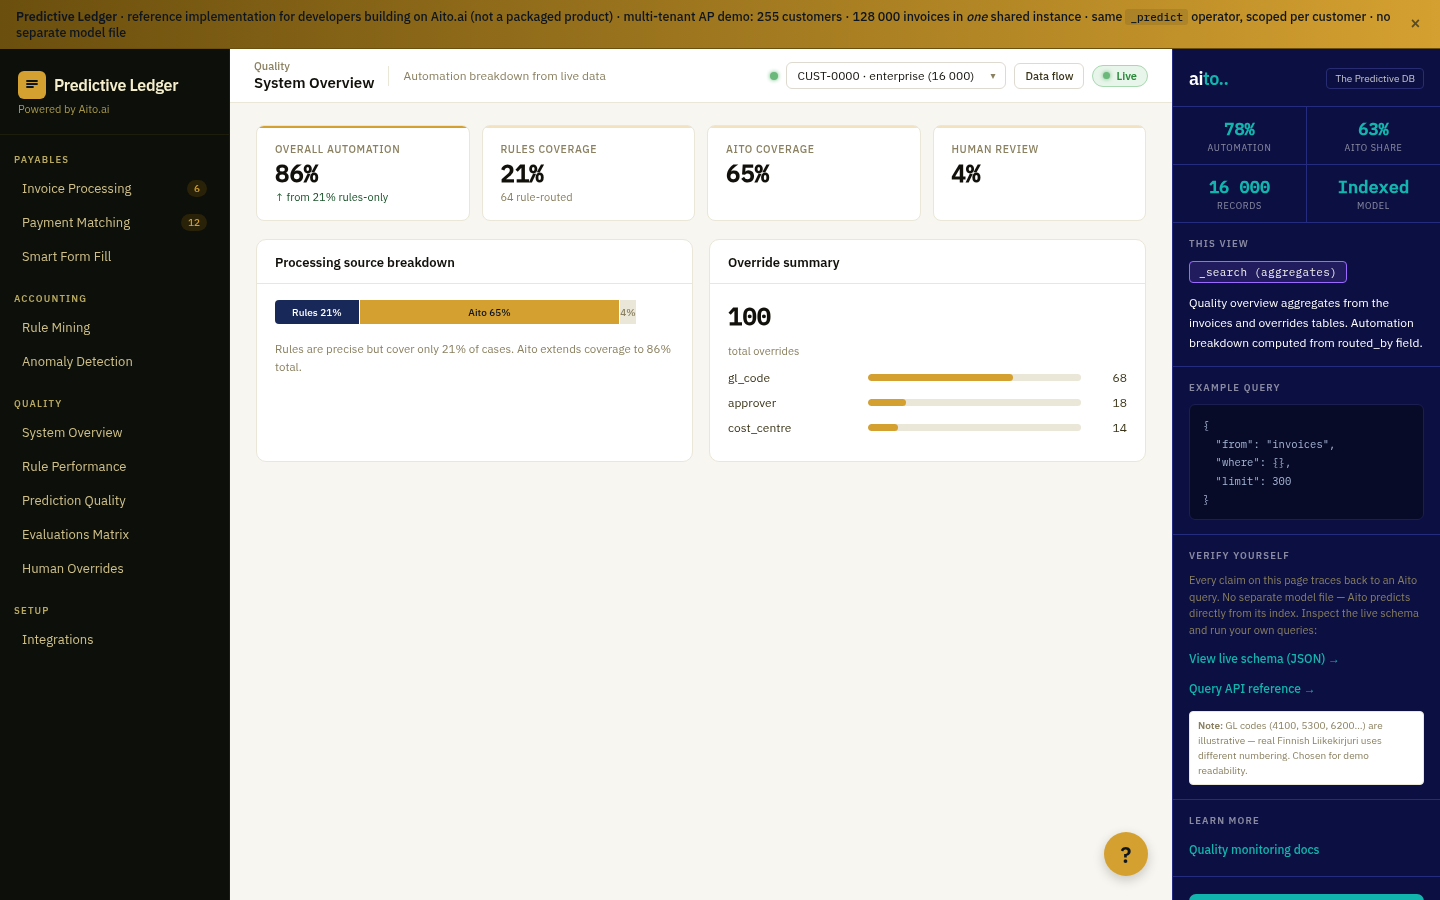
The quality dashboard runs _evaluate on a held-out slice of the live data on a regular cadence (daily, hourly for high-volume tenants). Per field, per confidence bucket, the dashboard surfaces accuracy, ECE, sample size, and the green/red diff vs the always-predict-majority baseline. Failed predictions (gain <= 0) render as red rows; on-track predictions render as green.
The dashboard is the operational view; calibration monitoring is the over-time view. The dashboard answers "how is the prediction performing right now?"; calibration monitoring tracks how that answer drifts week-over-week. Different audiences read each: the AP lead reads the dashboard daily, the data team reads the drift tracker weekly.
{
  "from": "invoices",
  "evaluate": "gl_code",
  "where": { "posted_date_within": "7_days" },
  "select": ["$accuracy", "$baseline_accuracy", "$gain_pp", "$ece", "$confidence_buckets"]
}
For the full architecture, see the technology overview. For the broader narrative across multiple use cases, read The Predictive Application.
See it live
This use case runs in the 🧾 Accounting demo today. Click through to the live application and inspect the queries that produce the result. Source is on GitHub under Apache 2.0.
Frequently asked
How often should the dashboard refresh?
Daily is the floor for non-trivial volume; hourly for high-volume tenants where the auto-process tier sees large transaction counts. Less frequent refreshes mean drift gets noticed late — by the time you see the dashboard, the bad predictions are already in the books.
What confidence buckets should we use?
Five tiers fit most use cases: >95%, 90-95%, 75-90%, 50-75%, <50%. The >95% bucket should be the auto-process tier; check its calibration the most often. Lower tiers can be summarised in coarser bands without losing actionable signal.
Can the dashboard surface per-tenant calibration in multi-tenant deployments?
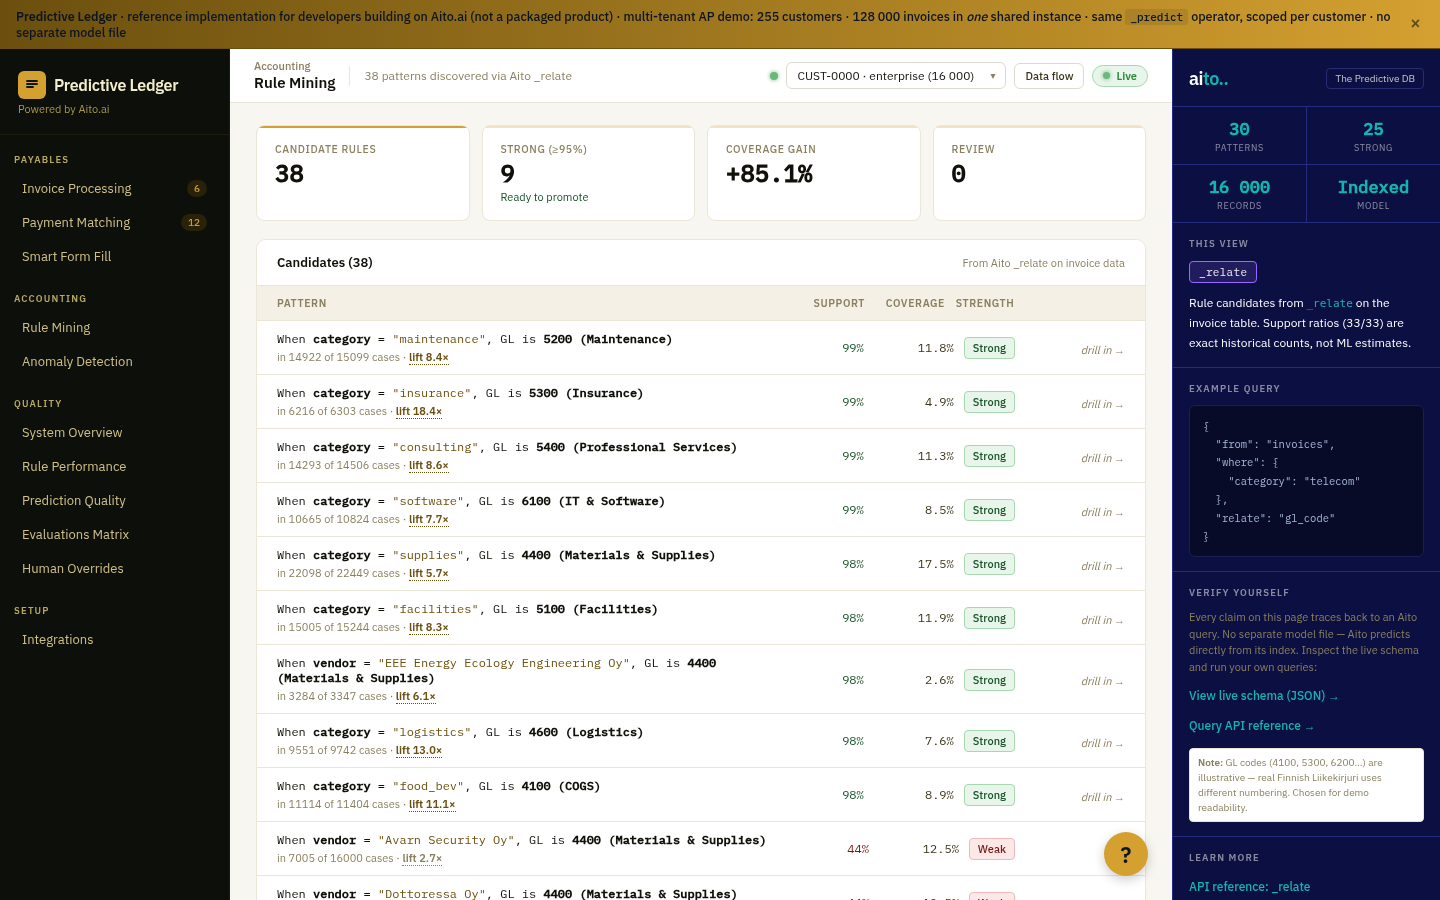
Yes. Run _evaluate with a customer_id filter; the calibration is per-tenant. Multi-tenant accounting deployments at the accounting.aito.ai demo run this pattern across 255 tenants — each tenant's dashboard reflects its own data.
What action should we take when a field's calibration breaks?
Two responses depending on severity. Mild miscalibration (ECE 0.05-0.10): lower the auto-process threshold for that field temporarily; manual review absorbs the uncertainty. Severe (ECE >0.15): pause auto-processing on that field entirely until the underlying cause is identified.
Is the dashboard built into Aito or do we build it ourselves?
Aito returns the metrics; the dashboard UI is yours to build (or reuse). The accounting demo includes a reference implementation of the quality dashboard you can fork. Most deployments customise the dashboard to fit their existing operational tooling.