The problem
Calibration drift is the silent failure mode of confidence-tiered automation. The system worked fine for months; the team got comfortable; usage grew; nobody noticed that the 95% confidence tier started producing errors at 5% instead of 1%. The first signal is usually a customer complaint, a tax filing correction, or an audit finding. By then the bad predictions are weeks old.
The remedy is monitoring the calibration over time, not just at one snapshot. ECE tracked weekly tells you whether 95% confidence still means 95% accuracy — and surfaces an alert before the tier degrades to where the team would notice.
How it works
Calibration monitoring runs _evaluate on rolling windows (last 7, 30, 90 days) and tracks ECE per field over time. The system computes the moving average and the standard deviation; when the current week's ECE exceeds the historical average by N standard deviations, an alert fires.
Two failure modes get caught. Slow drift (data distribution shifts gradually, calibration degrades over weeks) shows up as a steady ECE rise; sudden drift (a chart-of-accounts reorganisation, a vendor migration, a product launch) shows up as a one-week spike. Both surface in the same dashboard; both warrant different remediation. Slow drift usually means re-tune thresholds; sudden drift usually means pause auto-process on affected fields until the new pattern accumulates.
{
  "from": "invoices",
  "evaluate": "gl_code",
  "where": { "posted_date_within": "7_days" },
  "select": ["$ece", "$accuracy", "$sample_size"],
  "groupBy": "week"
}
For the full architecture, see the technology overview. For the broader narrative across multiple use cases, read The Predictive Application.
See it live
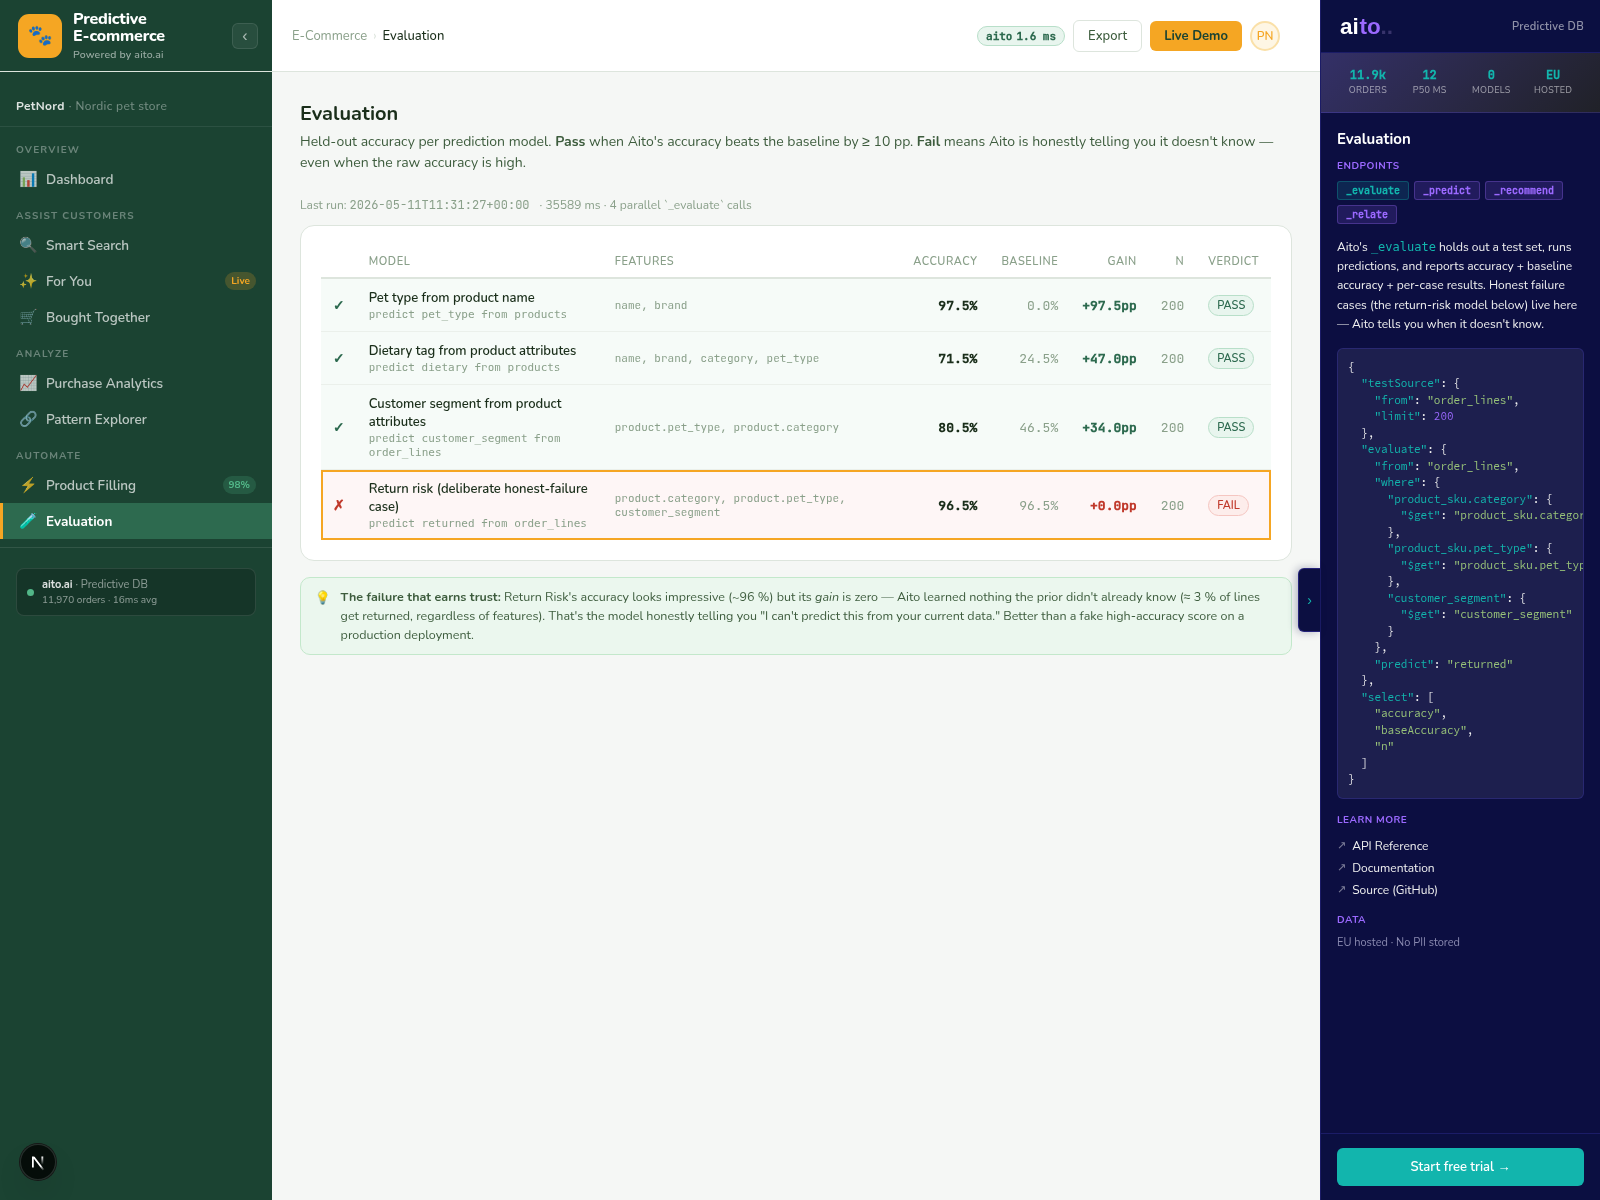
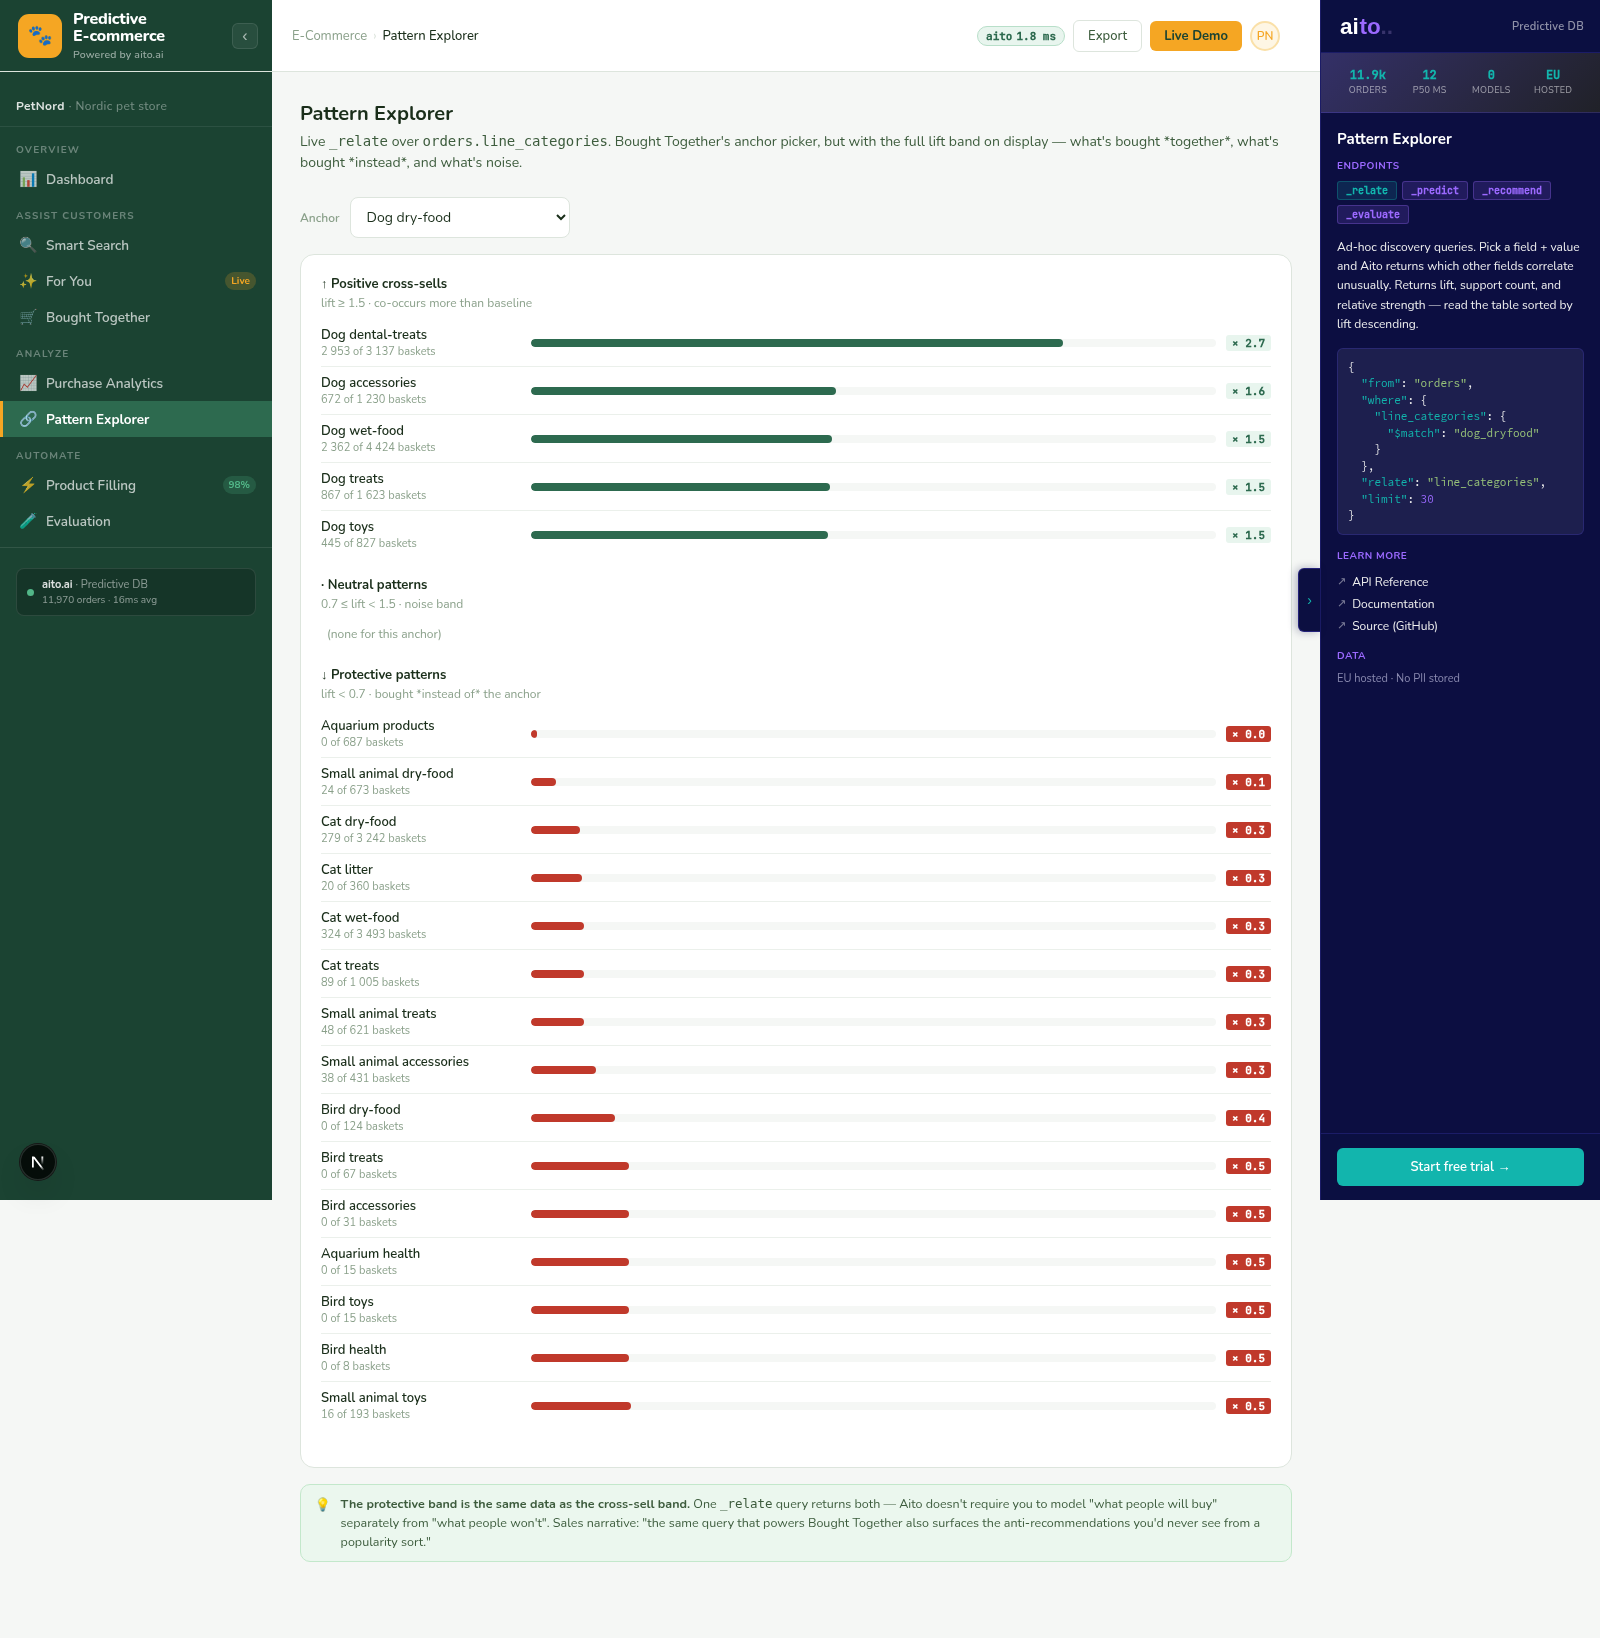
This use case runs in the 🛒 E-commerce demo today. Click through to the live application and inspect the queries that produce the result. Source is on GitHub under Apache 2.0.
Frequently asked
What ECE threshold should trigger an alert?
Practical thresholds: ECE > 0.05 on the >95% confidence bucket is the warning level; ECE > 0.10 is the action level. These vary by field and stakes — high-stakes fields (GL coding, regulatory tags) warrant tighter thresholds than low-stakes fields (tag prediction).
How does this compare to standard ML model-drift monitoring (Evidently, WhyLabs)?
Standard model-drift tools monitor input-feature distributions and output distributions. Calibration monitoring is narrower: just calibration, just on the predictions you care about for automation. The two are complementary; teams that use both get input-drift early-warning AND output-calibration safety together.
Can we monitor calibration per customer in multi-tenant deployments?
Yes. ECE per customer_id, tracked over time. Useful when a single tenant's calibration breaks while the rest are fine — usually means tenant-specific data shift (chart-of-accounts change, vendor migration) that needs attention.
What happens when a calibration alert fires?
The application acts on the alert. Default behaviour: lower the auto-process threshold for the affected field by 5-10 percentage points. Manual review absorbs the uncertainty until the calibration recovers or the team investigates the root cause.
How quickly does calibration recover after a data-pattern shift?
Calibration recovery follows the same data-density curve as initial calibration. Three observations of the new pattern reaches ~85-90% calibrated; ten observations is usually fully calibrated. Recovery time depends on transaction volume — high-volume tenants recover within days, low-volume tenants over weeks.