The problem
Customer segmentation usually starts with a clustering run: pick k-means or a hierarchy, engineer some features, and get clusters that are similar to each other but not necessarily different in anything the business acts on. Then someone has to name them, and the next run moves the boundaries.
Most segmentation questions have an outcome behind them anyway: who churns, who converts, who pays late. When the outcome is known, the useful segments are the ones that differ on it, and the useful description of a segment is what makes it differ and what would change it.
How it works
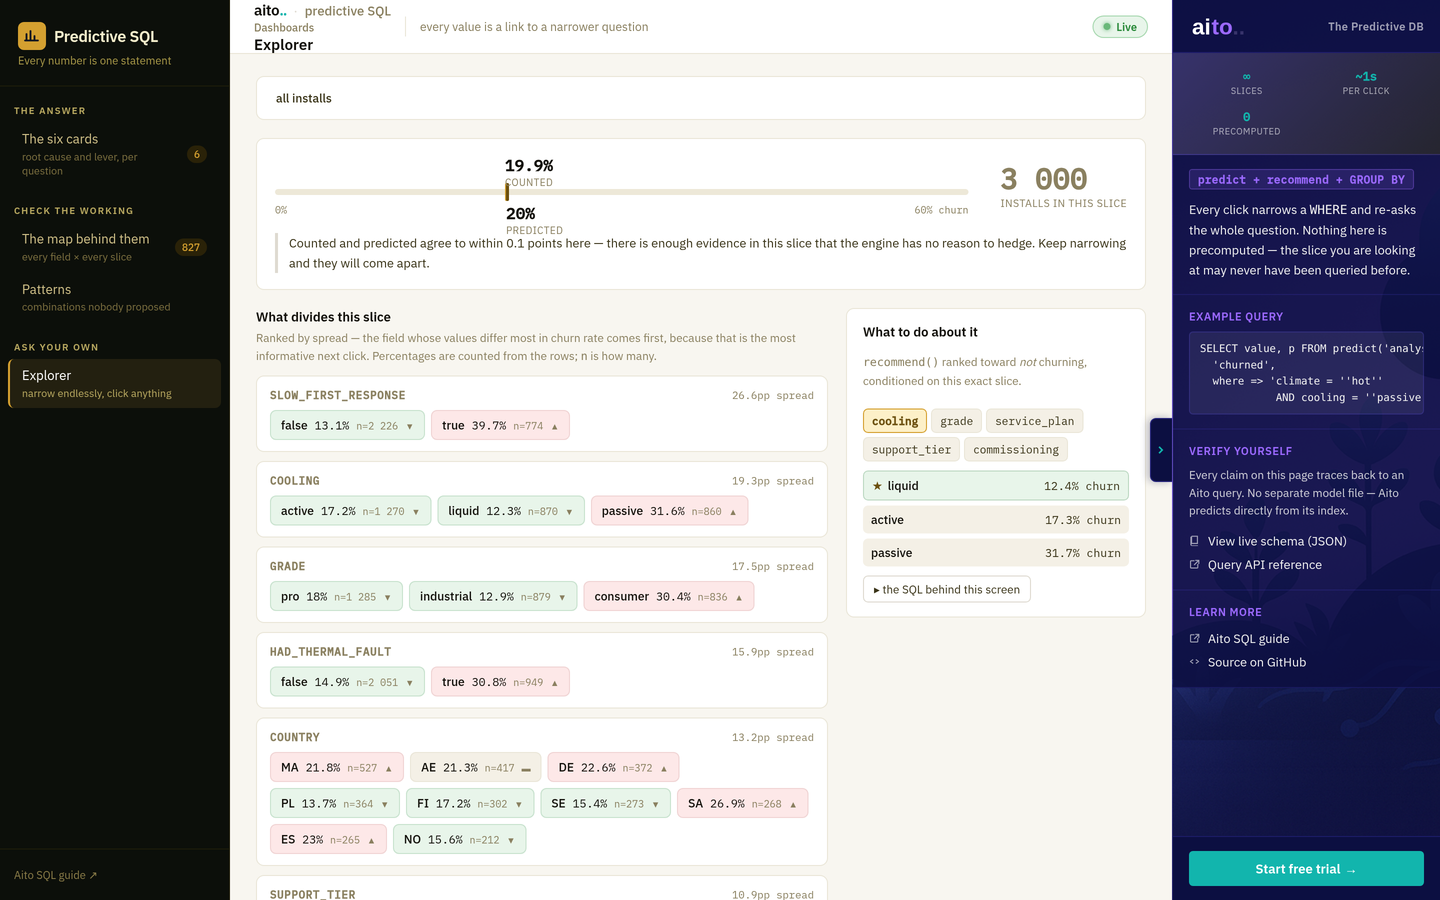
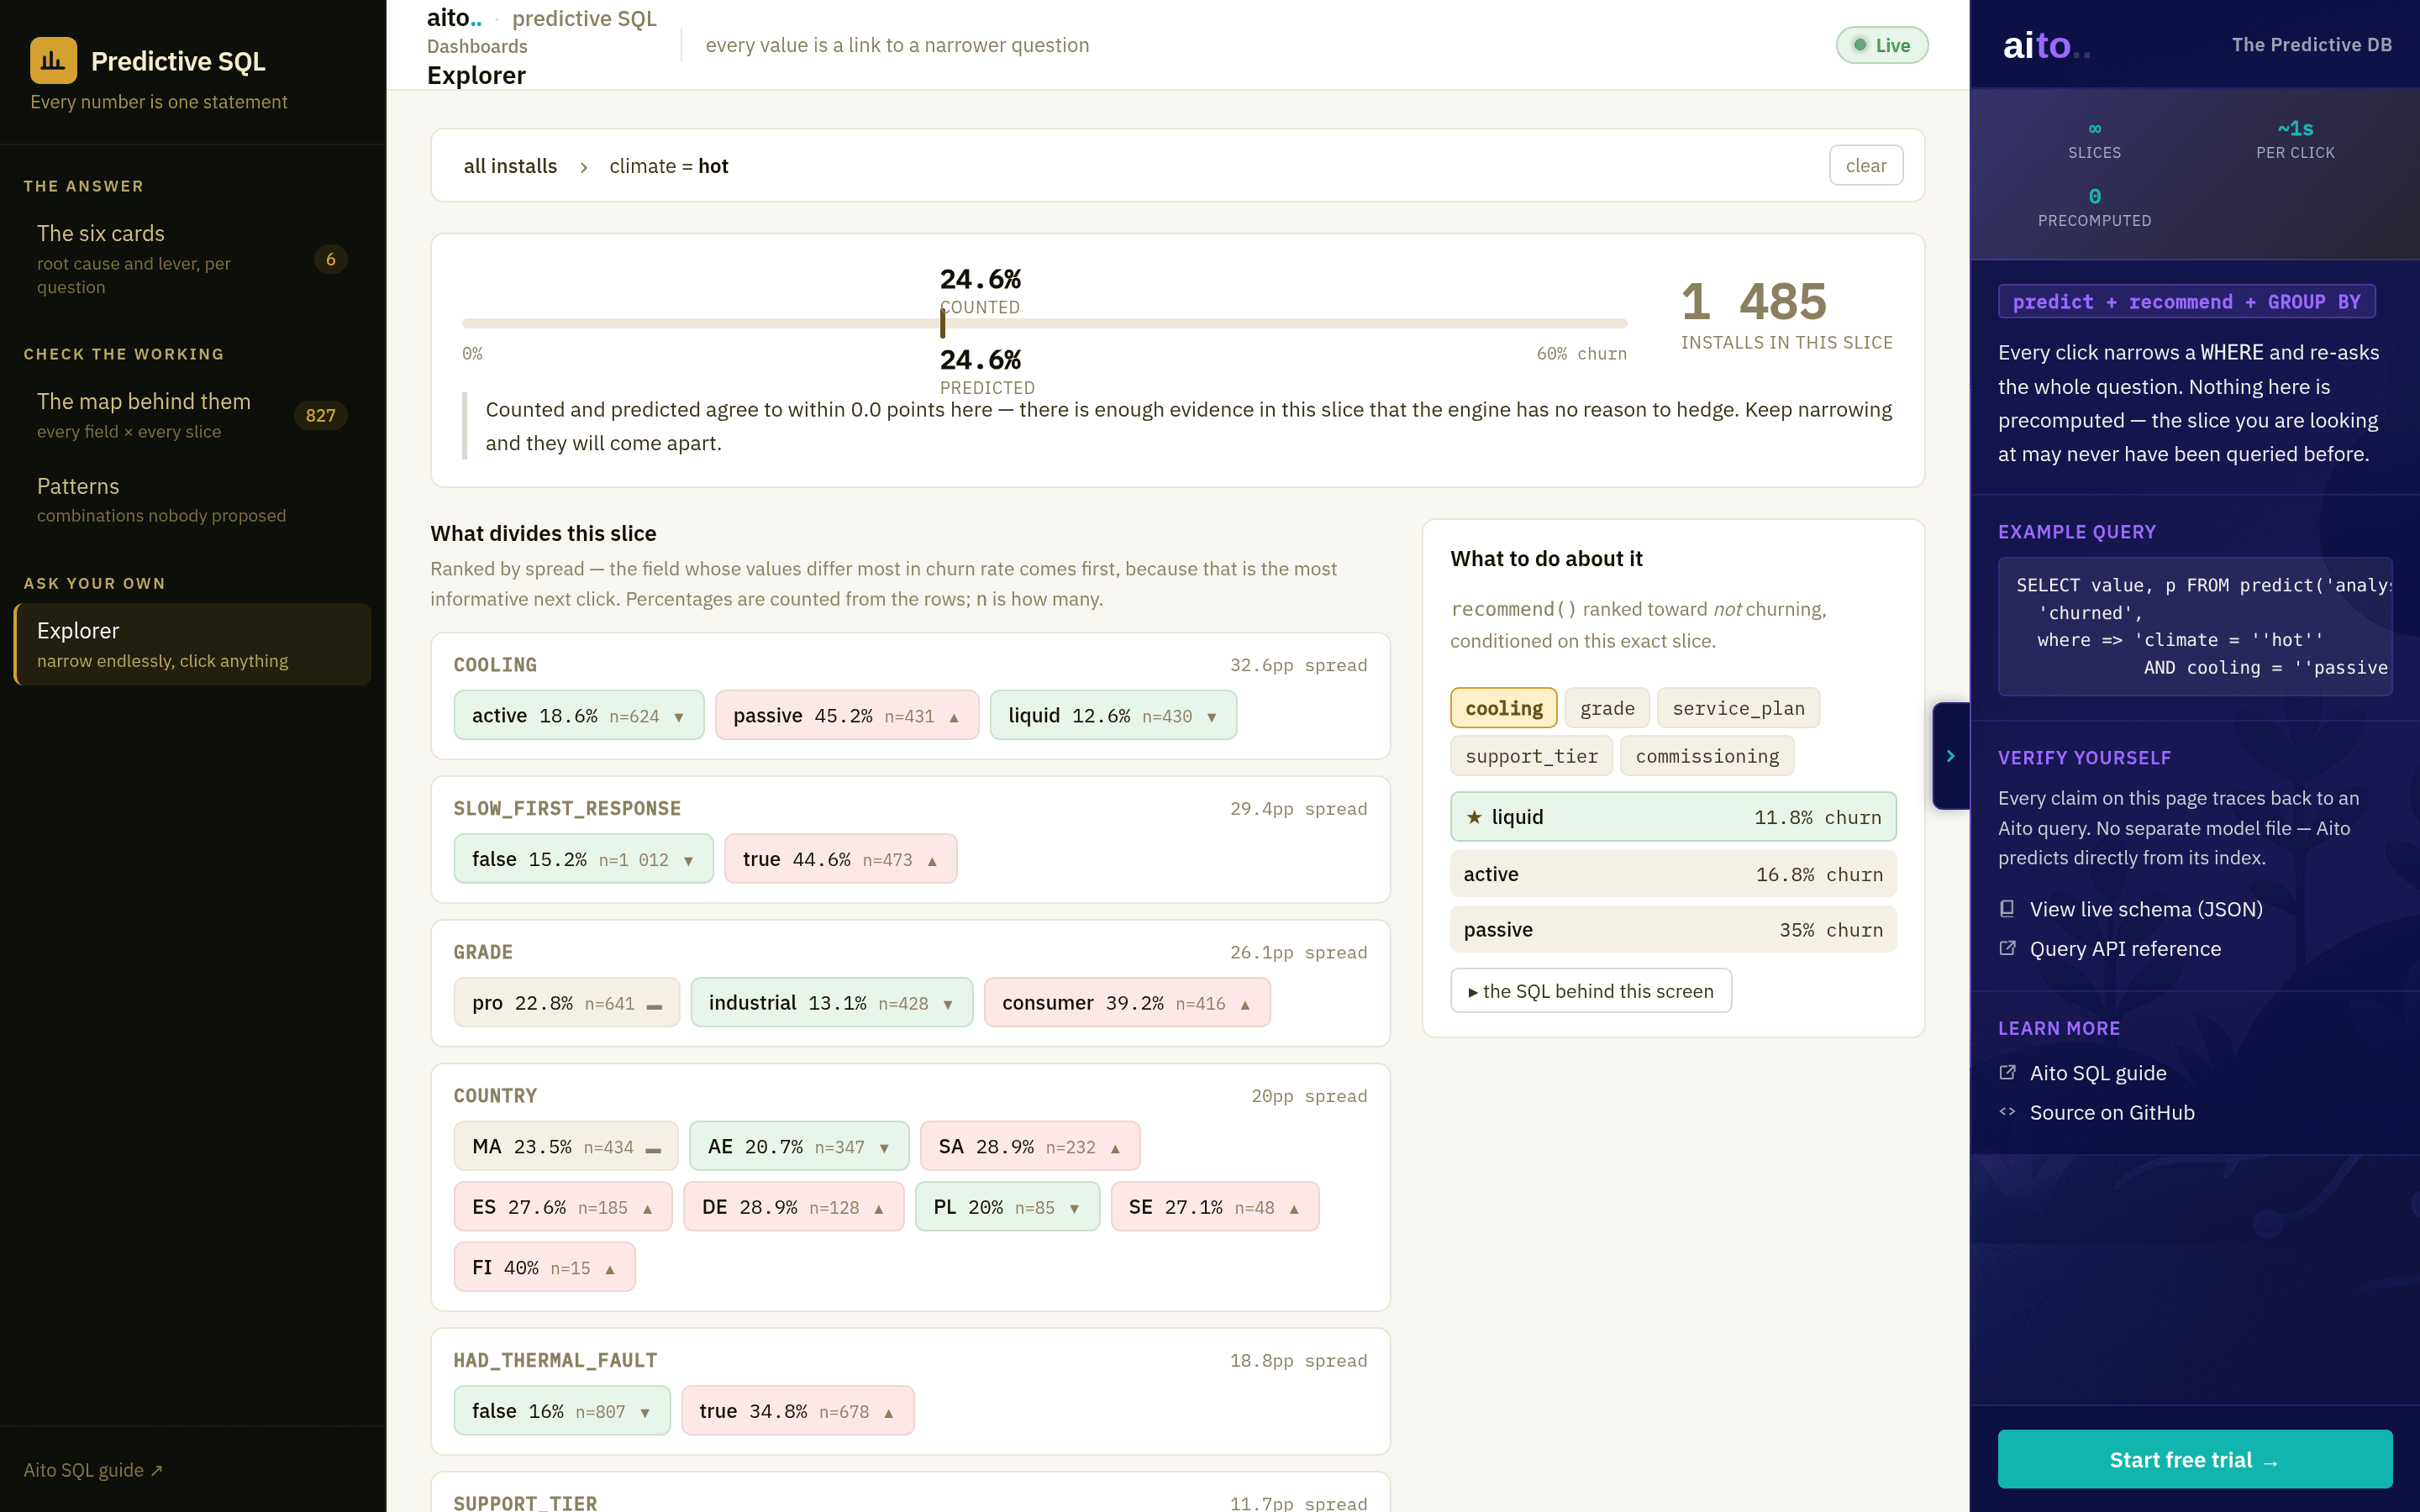
Pick the outcome and the population. For every field, the explorer counts the outcome rate per value and ranks the fields by spread, so the split that separates customers most comes first. Each value is a segment you can step into; the next click narrows it further, and every segment is a plain condition you can read, count and reuse.
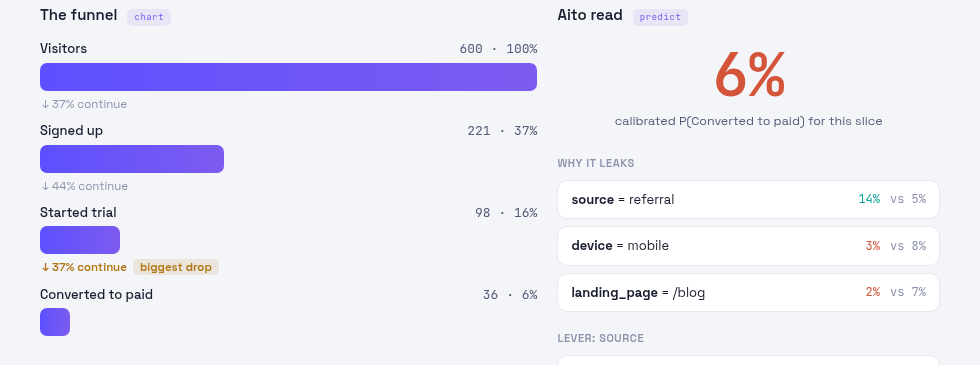
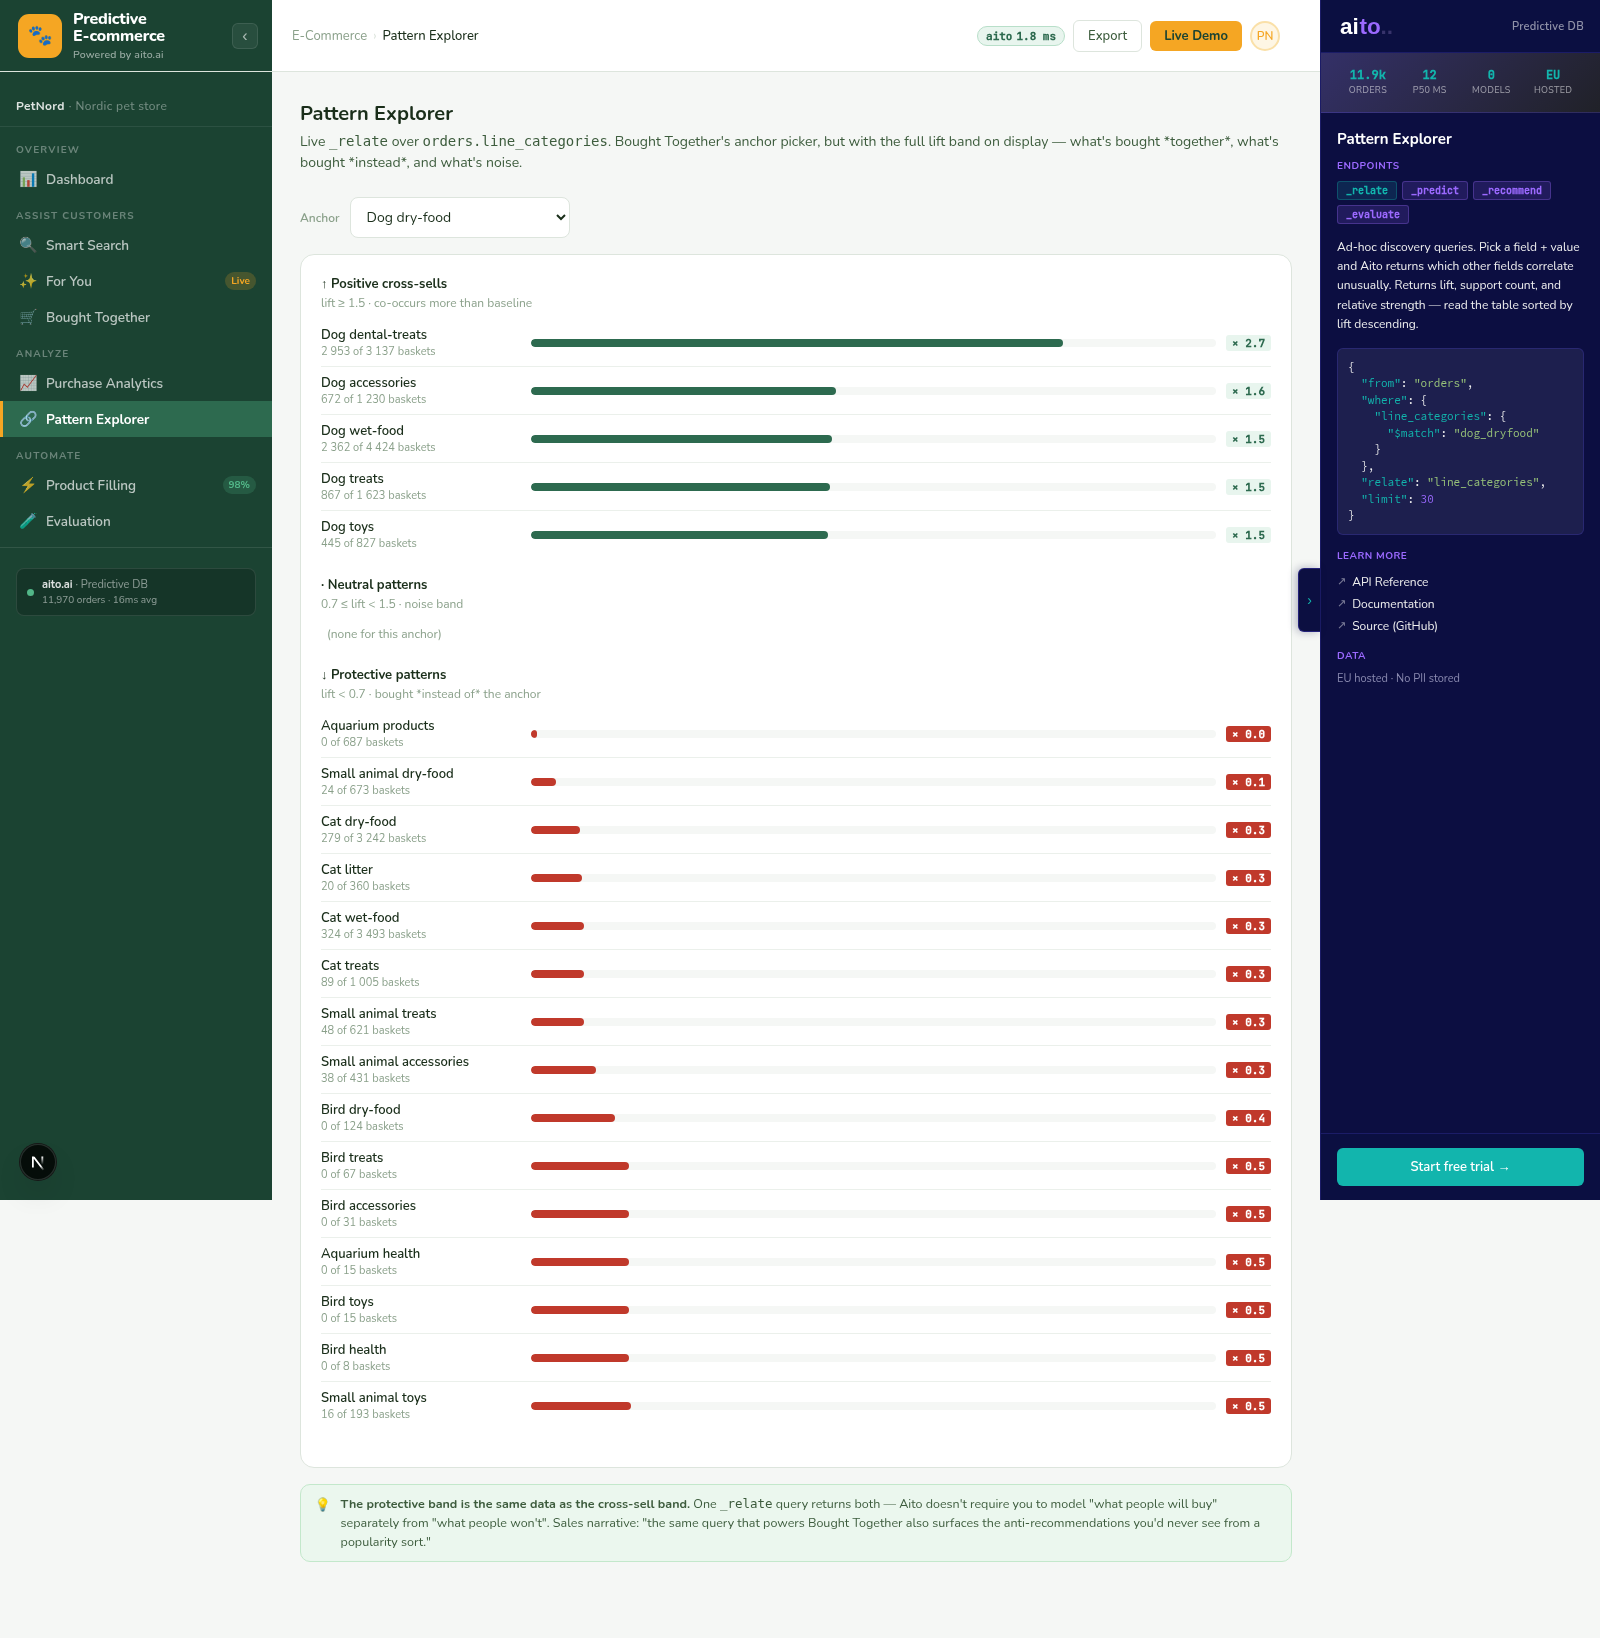
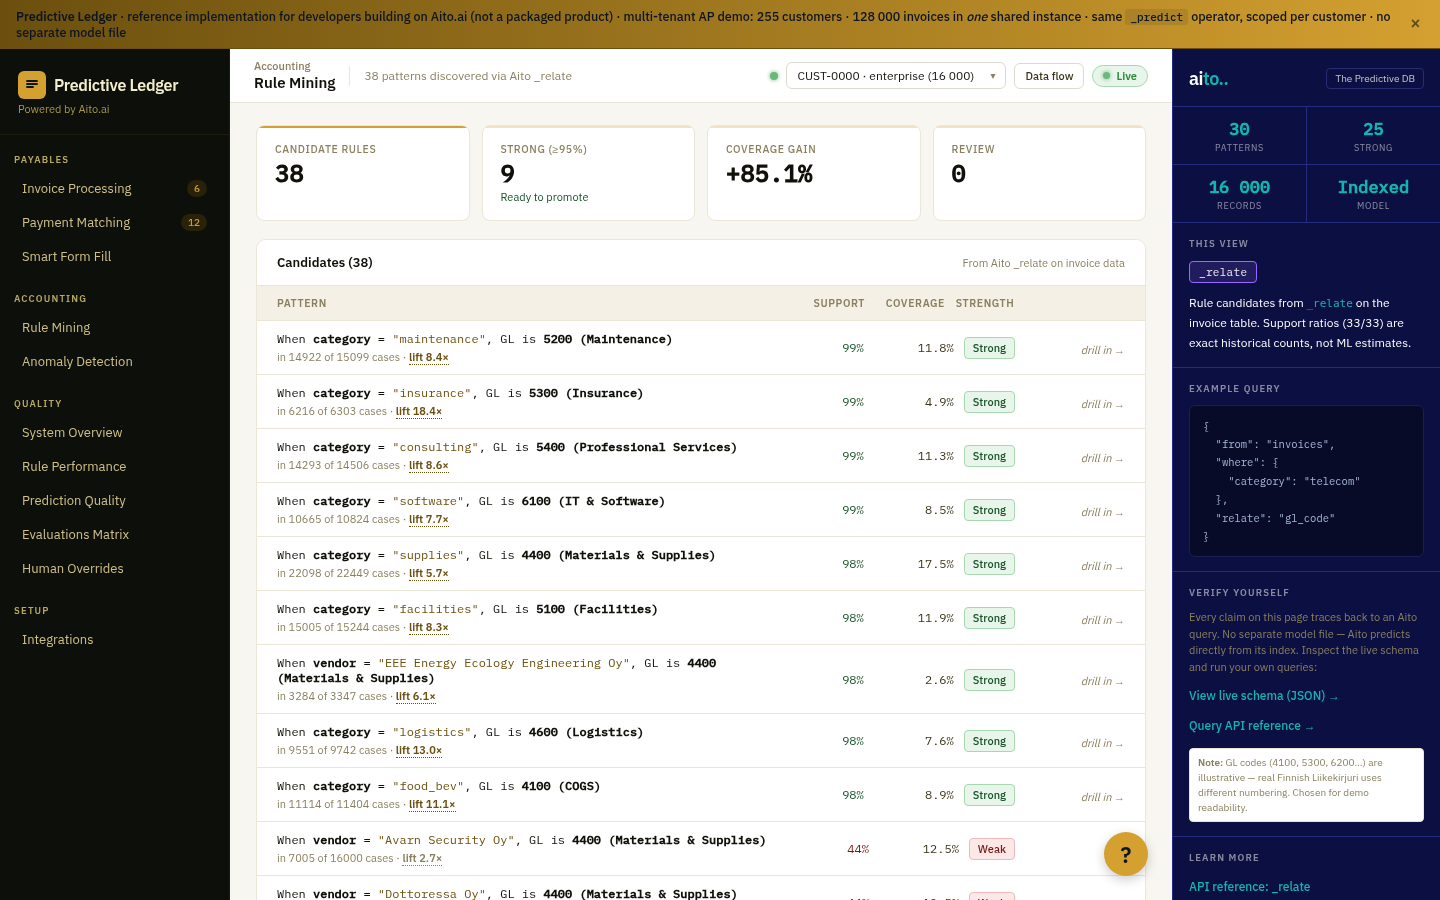
Inside a segment, predict() gives the calibrated rate, and it says so when the segment is too thin to trust: it holds back toward the base rate and shows the gap to the counted rate. recommend() ranks the values of a field you control toward the better outcome, given that segment, and _relate gives the segment's root causes, as in the 360 dashboard.
What this is not: unsupervised clustering. If you need personas with no outcome behind them, a clustering tool is the right one; Aito segments with respect to a target.
SELECT value, p FROM predict('analysis', 'churned',
  where => 'climate = ''hot''');

SELECT value, p FROM recommend('analysis', 'cooling',
  goal => 'churned = ''false''',
  given => 'climate = ''hot''', k => 5);
For the full architecture, see the technology overview. For the broader narrative across multiple use cases, read The Predictive Application.
See it live
This use case runs in 2 live demos today, the 🐘 SQL and 🤖 Agent demos. Each link opens the view that shows it, where you can inspect the queries that produce the result.
Frequently asked
How does this compare to k-means or hierarchical clustering?
Clustering groups customers who look alike, with no target; this splits them by how an outcome differs, so every segment comes with its rate, its size and a readable definition. They answer different questions. For personas without an outcome, use clustering; for "which customers churn, and what would change it", segment by the outcome.
Can segments be exported to email or campaign tools?
A segment is a where clause, so its members are one query away: select the customer ids matching the condition and hand them to the campaign tool. Over SQL, any tool that reads Postgres can pull the list directly.
How small can a segment get before the numbers stop meaning anything?
Every value carries its row count, and the prediction pulls toward the base rate when the evidence is thin. In the demo, narrowing the hot-climate segment to passive cooling (431 installs) gives a prediction several points below the counted rate for exactly that reason, and the screen says so. Treat a large gap between counted and predicted as a sign to stop narrowing.
Does this work for B2B, with fewer customers?
Yes, with fewer steps of narrowing. Fewer customers means each segment is thinner, so the calibrated rate stays closer to the base rate sooner, which is the honest behaviour. Account-level fields such as industry, contract size or support tier are usually the first useful splits.
Can segments be used as input to other predictions?
Yes. A segment is a condition, so it goes into the where of any prediction: "predict churn for this segment" or "recommend the plan for this segment" is the same query with the segment's condition added.