The problem
Utilization is the load-bearing metric in services-heavy organizations. Too low and margin suffers; too high and burnout follows. The capacity planner needs to know — for each consultant, for each upcoming month, given the project pipeline — what utilization is realistic. The answer drives hiring decisions, bench management, and bid commitments.
Most teams answer this with a planning spreadsheet someone updates weekly. The spreadsheet captures known commitments but does not capture the conditional probability of unconfirmed pipeline opportunities landing. The result is consistently over- or under-allocated forecasts, with reality drifting from the plan within weeks.
How it works
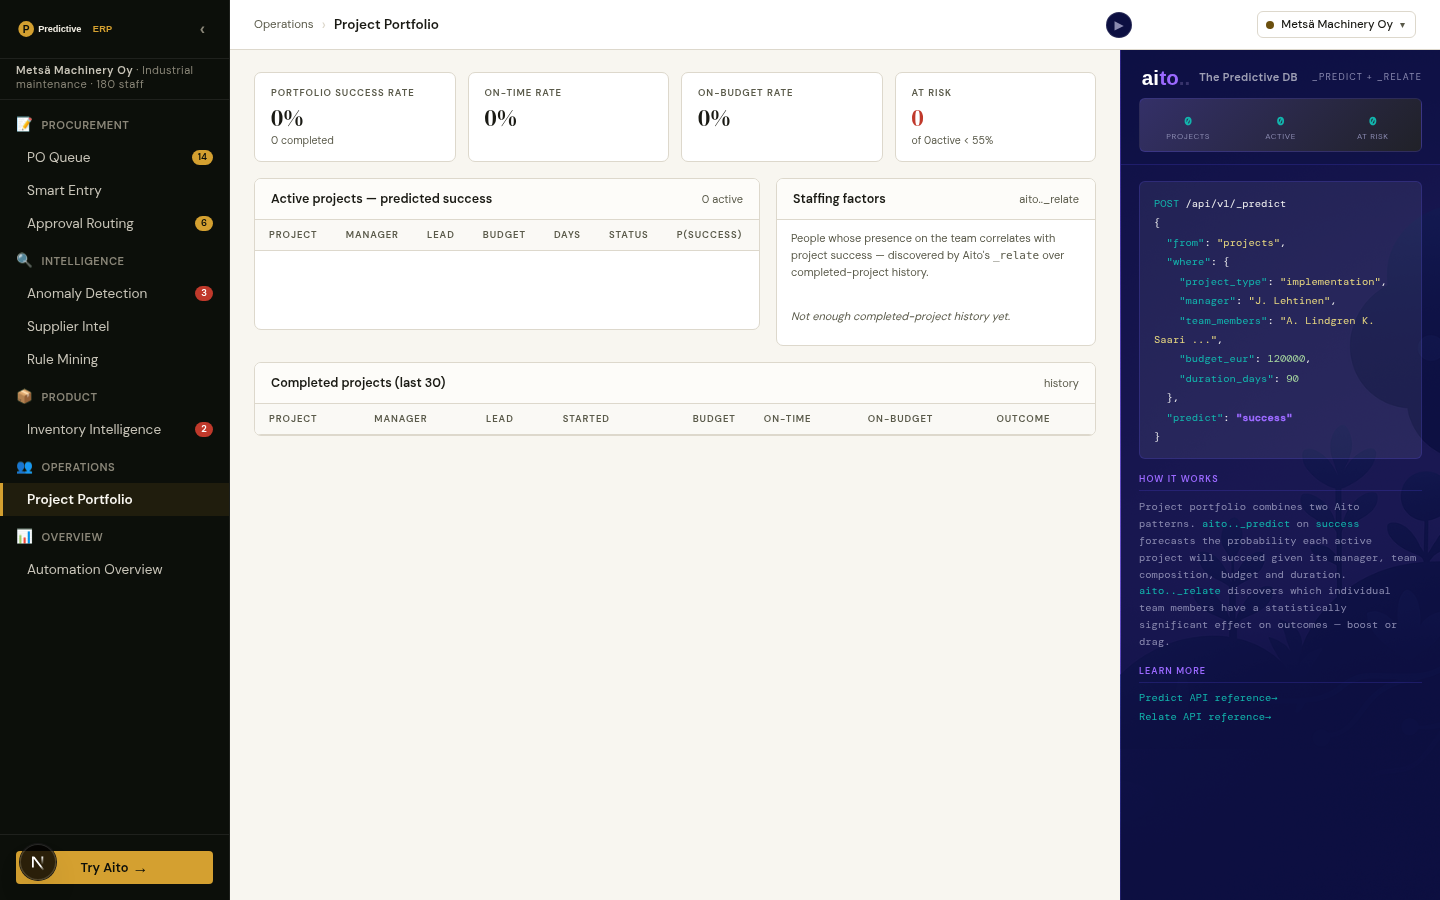
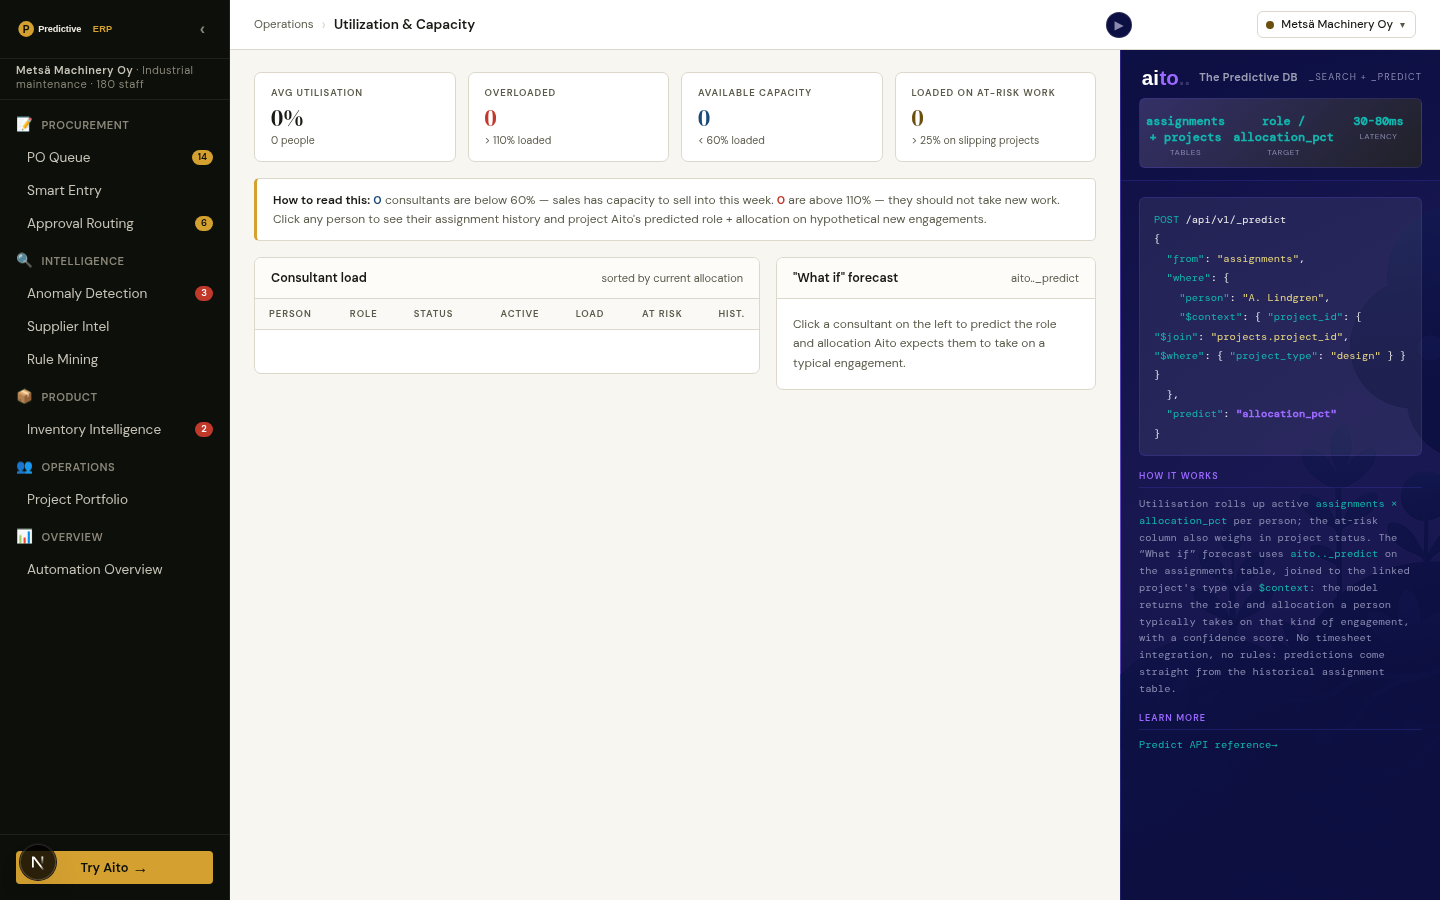
_predict allocation_pct on each consultant for each upcoming month, conditioned on the project pipeline state, the consultant's role, recent allocation patterns, and the pipeline-to-staffing conversion rate. The system blends confirmed commitments (high confidence) with predicted unconfirmed allocations (lower confidence) and produces a calibrated expected utilization.
The pipeline-conversion rate is itself a learned quantity — what fraction of qualified opportunities at the current stage typically convert to allocations? That conversion rate is the conditional probability the prediction needs. No separate Monte Carlo simulation; just the conditional probability over historical pipeline data.
{
  "from": "consultant_allocations",
  "where": {
    "consultant_id": "C-1042",
    "role": "senior_architect",
    "month": "2026-08",
    "pipeline_qualified_count": 4
  },
  "predict": "allocation_pct",
  "select": ["$p", "$why"]
}
For the full architecture, see the technology overview. For the broader narrative across multiple use cases, read The Predictive Application.
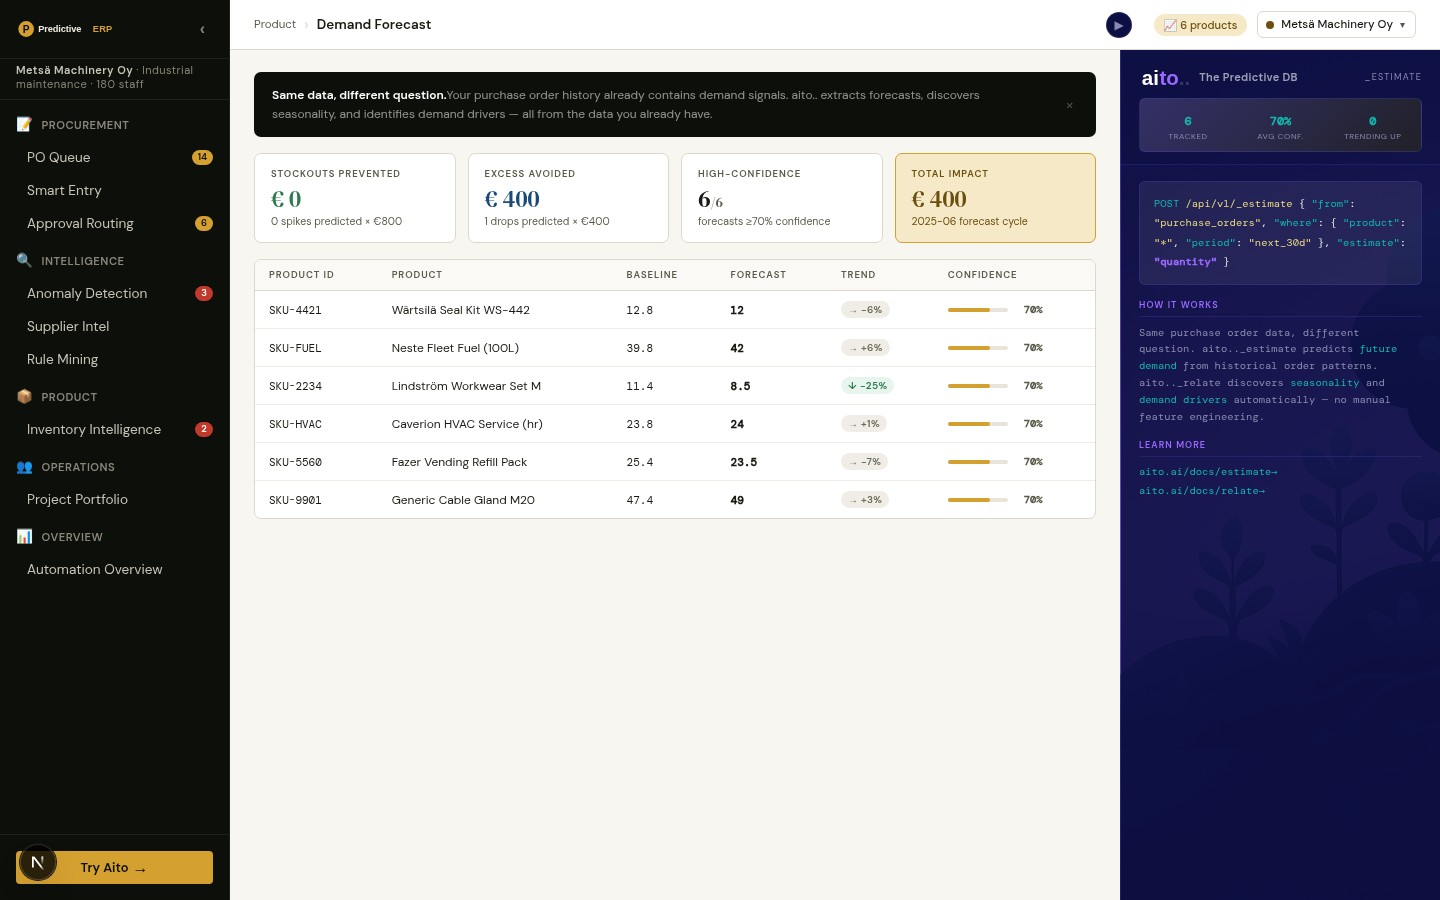
See it live
This use case runs in the 📋 ERP demo today. Click through to the live application and inspect the queries that produce the result. Source is on GitHub under Apache 2.0.
Frequently asked
How far ahead can the forecast see?
Practical horizon is 3-6 months. Beyond 6 months, the pipeline-conversion uncertainty dominates and predictions widen into broad bands. The forecast is most actionable for the next two months (capacity-locked) and useful through six months (hiring decisions).
Does this handle subcontractor capacity?
Yes. Subcontractors enter the same prediction as in-house consultants if their allocation history is in the data. Conditional probability is over whoever appears in the historical allocations table — internal employees, contractors, partner consultants, all treated the same way.
How does the prediction shift when a large project is won (or lost)?
The new commitment enters the data; the next query reflects it. For a large project win, predicted utilization shifts upward for the staffed consultants immediately. The forecast for unstaffed consultants shifts based on the conditional probability that they will be pulled in — driven by their role and past pattern.
Can we use this to drive hiring decisions?
Yes. If predicted demand exceeds predicted supply across roles, the gap drives hiring planning. The system surfaces the predicted role-level gap month-by-month with a confidence interval. Hiring cycles take months; the 3-6 month horizon matches the hiring lead time.
What if our consultants split time across cost centers or business units?
The prediction handles multi-allocation as a multi-row record. One consultant has multiple allocation rows per month, one per project or cost center. The forecast predicts each allocation_pct separately; the sum tells the capacity story.