The problem
Price oversight in procurement and retail is the kind of work that compounds when ignored. A supplier raises a price quietly; the team approves the PO at the new price; the variance shows up months later when someone runs the report. By then the cumulative exposure is in the tens or hundreds of thousands. The variance is detectable at posting time — the data has the historical price band — but the AP clerk doesn't notice because the new amount looks plausible.
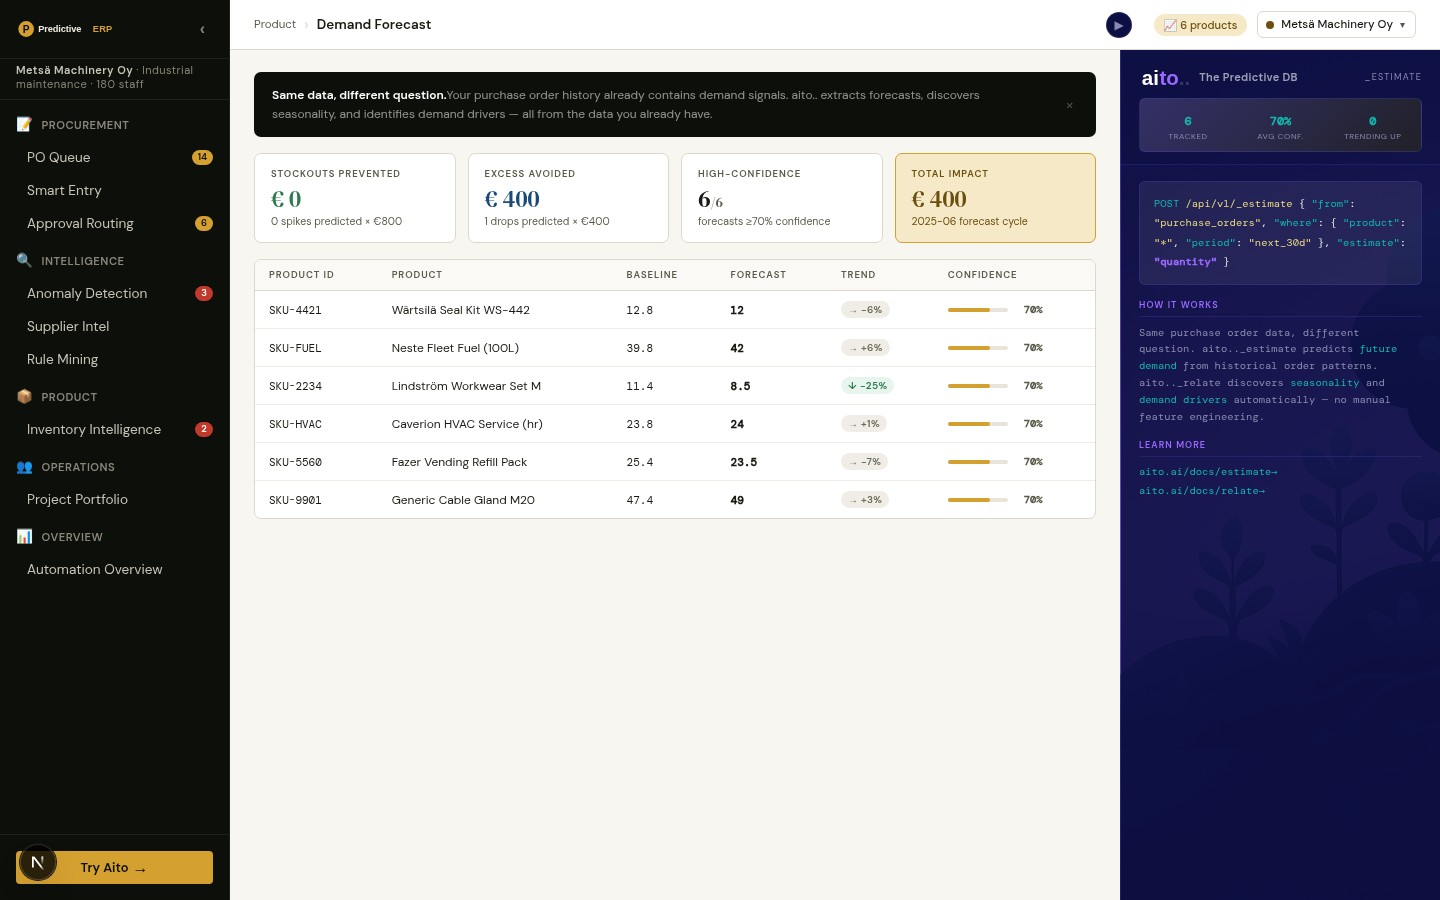
The same data that detects the variance can also estimate the fair price for a new SKU or a new supplier. "What should this Acme widget cost given the catalog, the supplier mix, and the historical price band for similar SKUs?" The conditional expected value is computable; the team is just not asking.
How it works
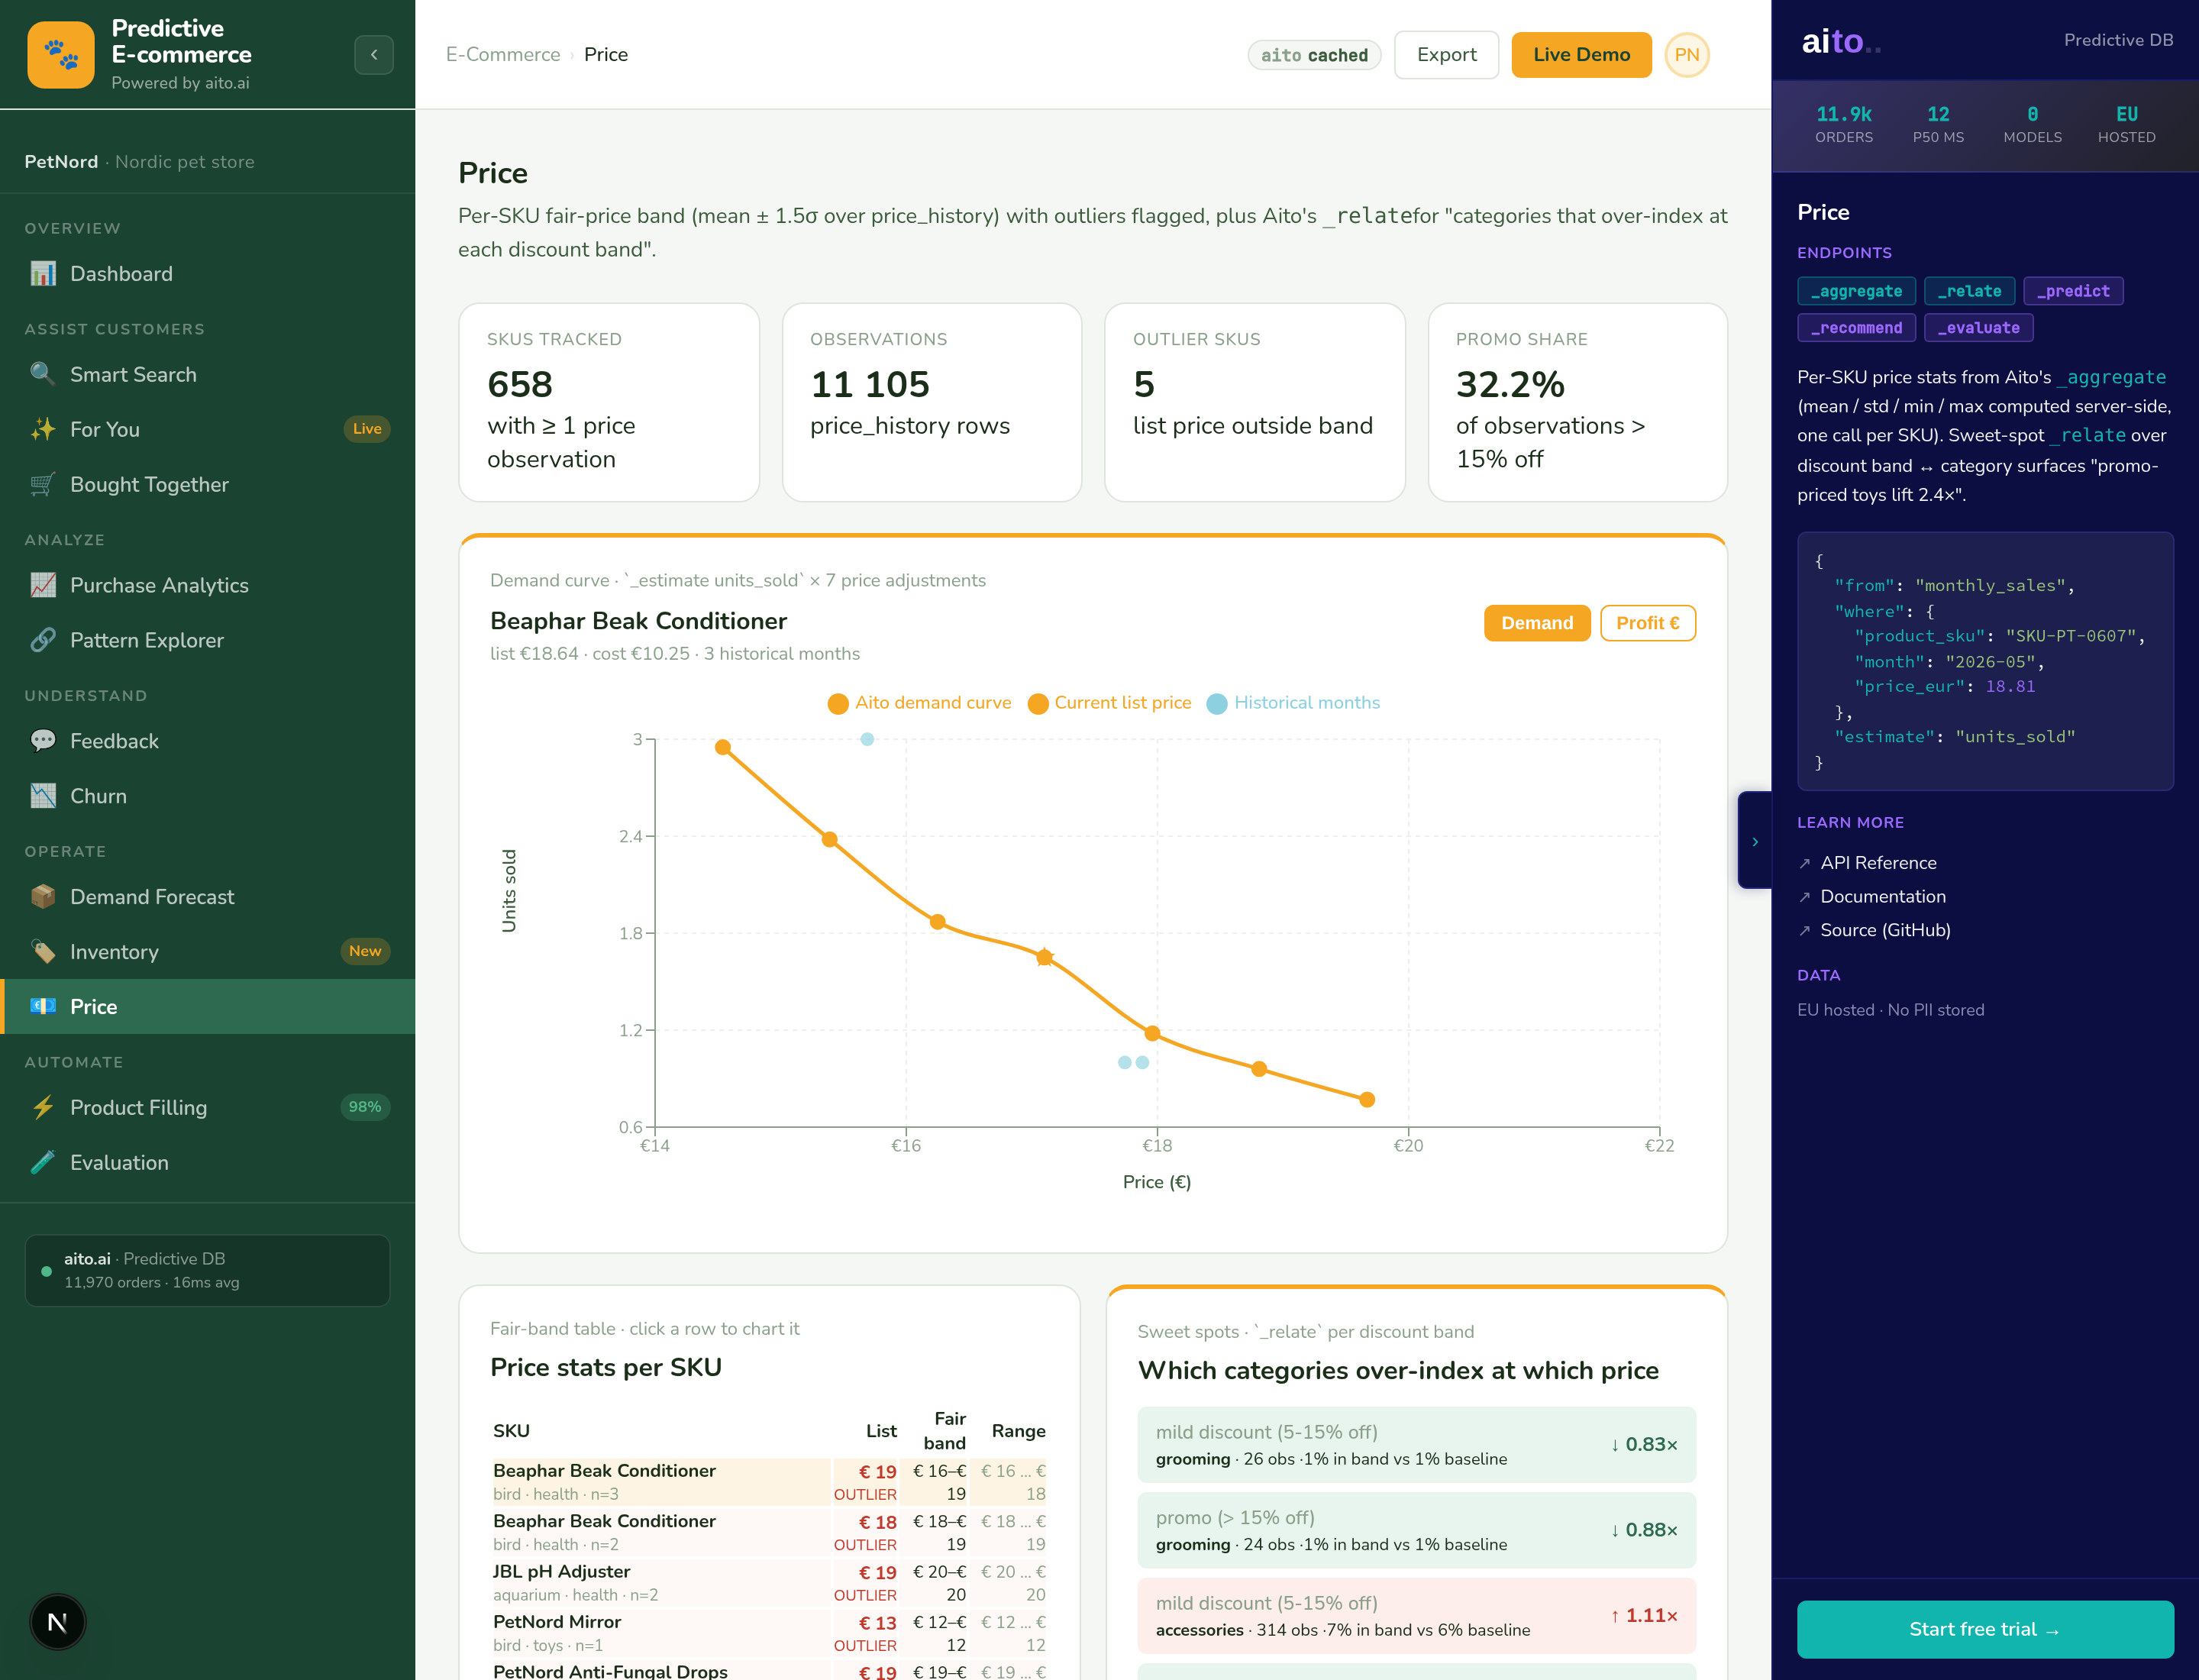
_estimate is the operator for predicted quantities. Run _estimate price on each new line conditioned on SKU, supplier, category, quantity. The result is a predicted fair-price band with calibrated confidence. The application compares the actual posted price; if it falls outside the predicted band at >85% top-1 confidence, surface as Purchase Price Variance with the predicted band, the actual price, and the variance percentage.
Annualised exposure is the prediction times the annual volume. A €2.40 unit-price variance on 12,000 units/year is €28,800 of annualised exposure — surfaceable immediately, actionable before the variance compounds.
{
  "from": "purchase_lines",
  "where": {
    "sku": "WIDGET-1042",
    "supplier": "Acme Supply Oy",
    "order_qty": 500
  },
  "estimate": "unit_price",
  "select": ["$p", "$why", "unit_price"]
}
For the full architecture, see the technology overview. For the broader narrative across multiple use cases, read The Predictive Application.
See it live
This use case runs in the 📋 ERP demo today. Click through to the live application and inspect the queries that produce the result. Source is on GitHub under Apache 2.0.
Frequently asked
How does this compare to dedicated procurement-analytics SaaS?
Dedicated tools have richer dashboards (waterfall charts, supplier scorecards) and more sophisticated variance categorisation. _estimate is the prediction primitive; the dashboards live in your existing reporting. The two compose: Aito does the math, your BI tool does the visualisation.
What about catalog items with no price history?
Predictions on no-history SKUs return low confidence. The system can infer through similarity — similar SKU, similar supplier, similar category — but with wider bands. New-SKU prices are surfaced as suggestions, not anomalies.
How does this handle bulk-discount tiers?
Add order_qty to the where clause; the predicted price conditions on quantity. Bulk-discount bands emerge from the conditional probability automatically. For SKUs with very tiered pricing, the prediction respects the tiers as long as the historical data shows them.
Can the prediction recommend a counter-offer price?
Yes — the predicted fair-price band IS the counter-offer reference. The buyer sees "this supplier quoted X; predicted fair-price band is Y to Z; variance of N%." The negotiation conversation has a citable anchor instead of an intuition.
Does this work for service catalogs (consulting rates, SaaS pricing)?
Yes. _estimate works on any numeric column. Consulting rate per role, SaaS price per tier, license fee per seat — all run the same conditional-probability machinery against the historical pricing data.