The problem
Inventory arithmetic is easy: stock on hand, lead time, reorder point. The hard input is next month's demand. With a flat average, fast movers stock out and slow movers pile up, and the capital tied in overstock never shows on the same screen as the revenue lost to stockouts.
Put the demand prediction into the same arithmetic and both risks rank on one scale: euros.
How it works
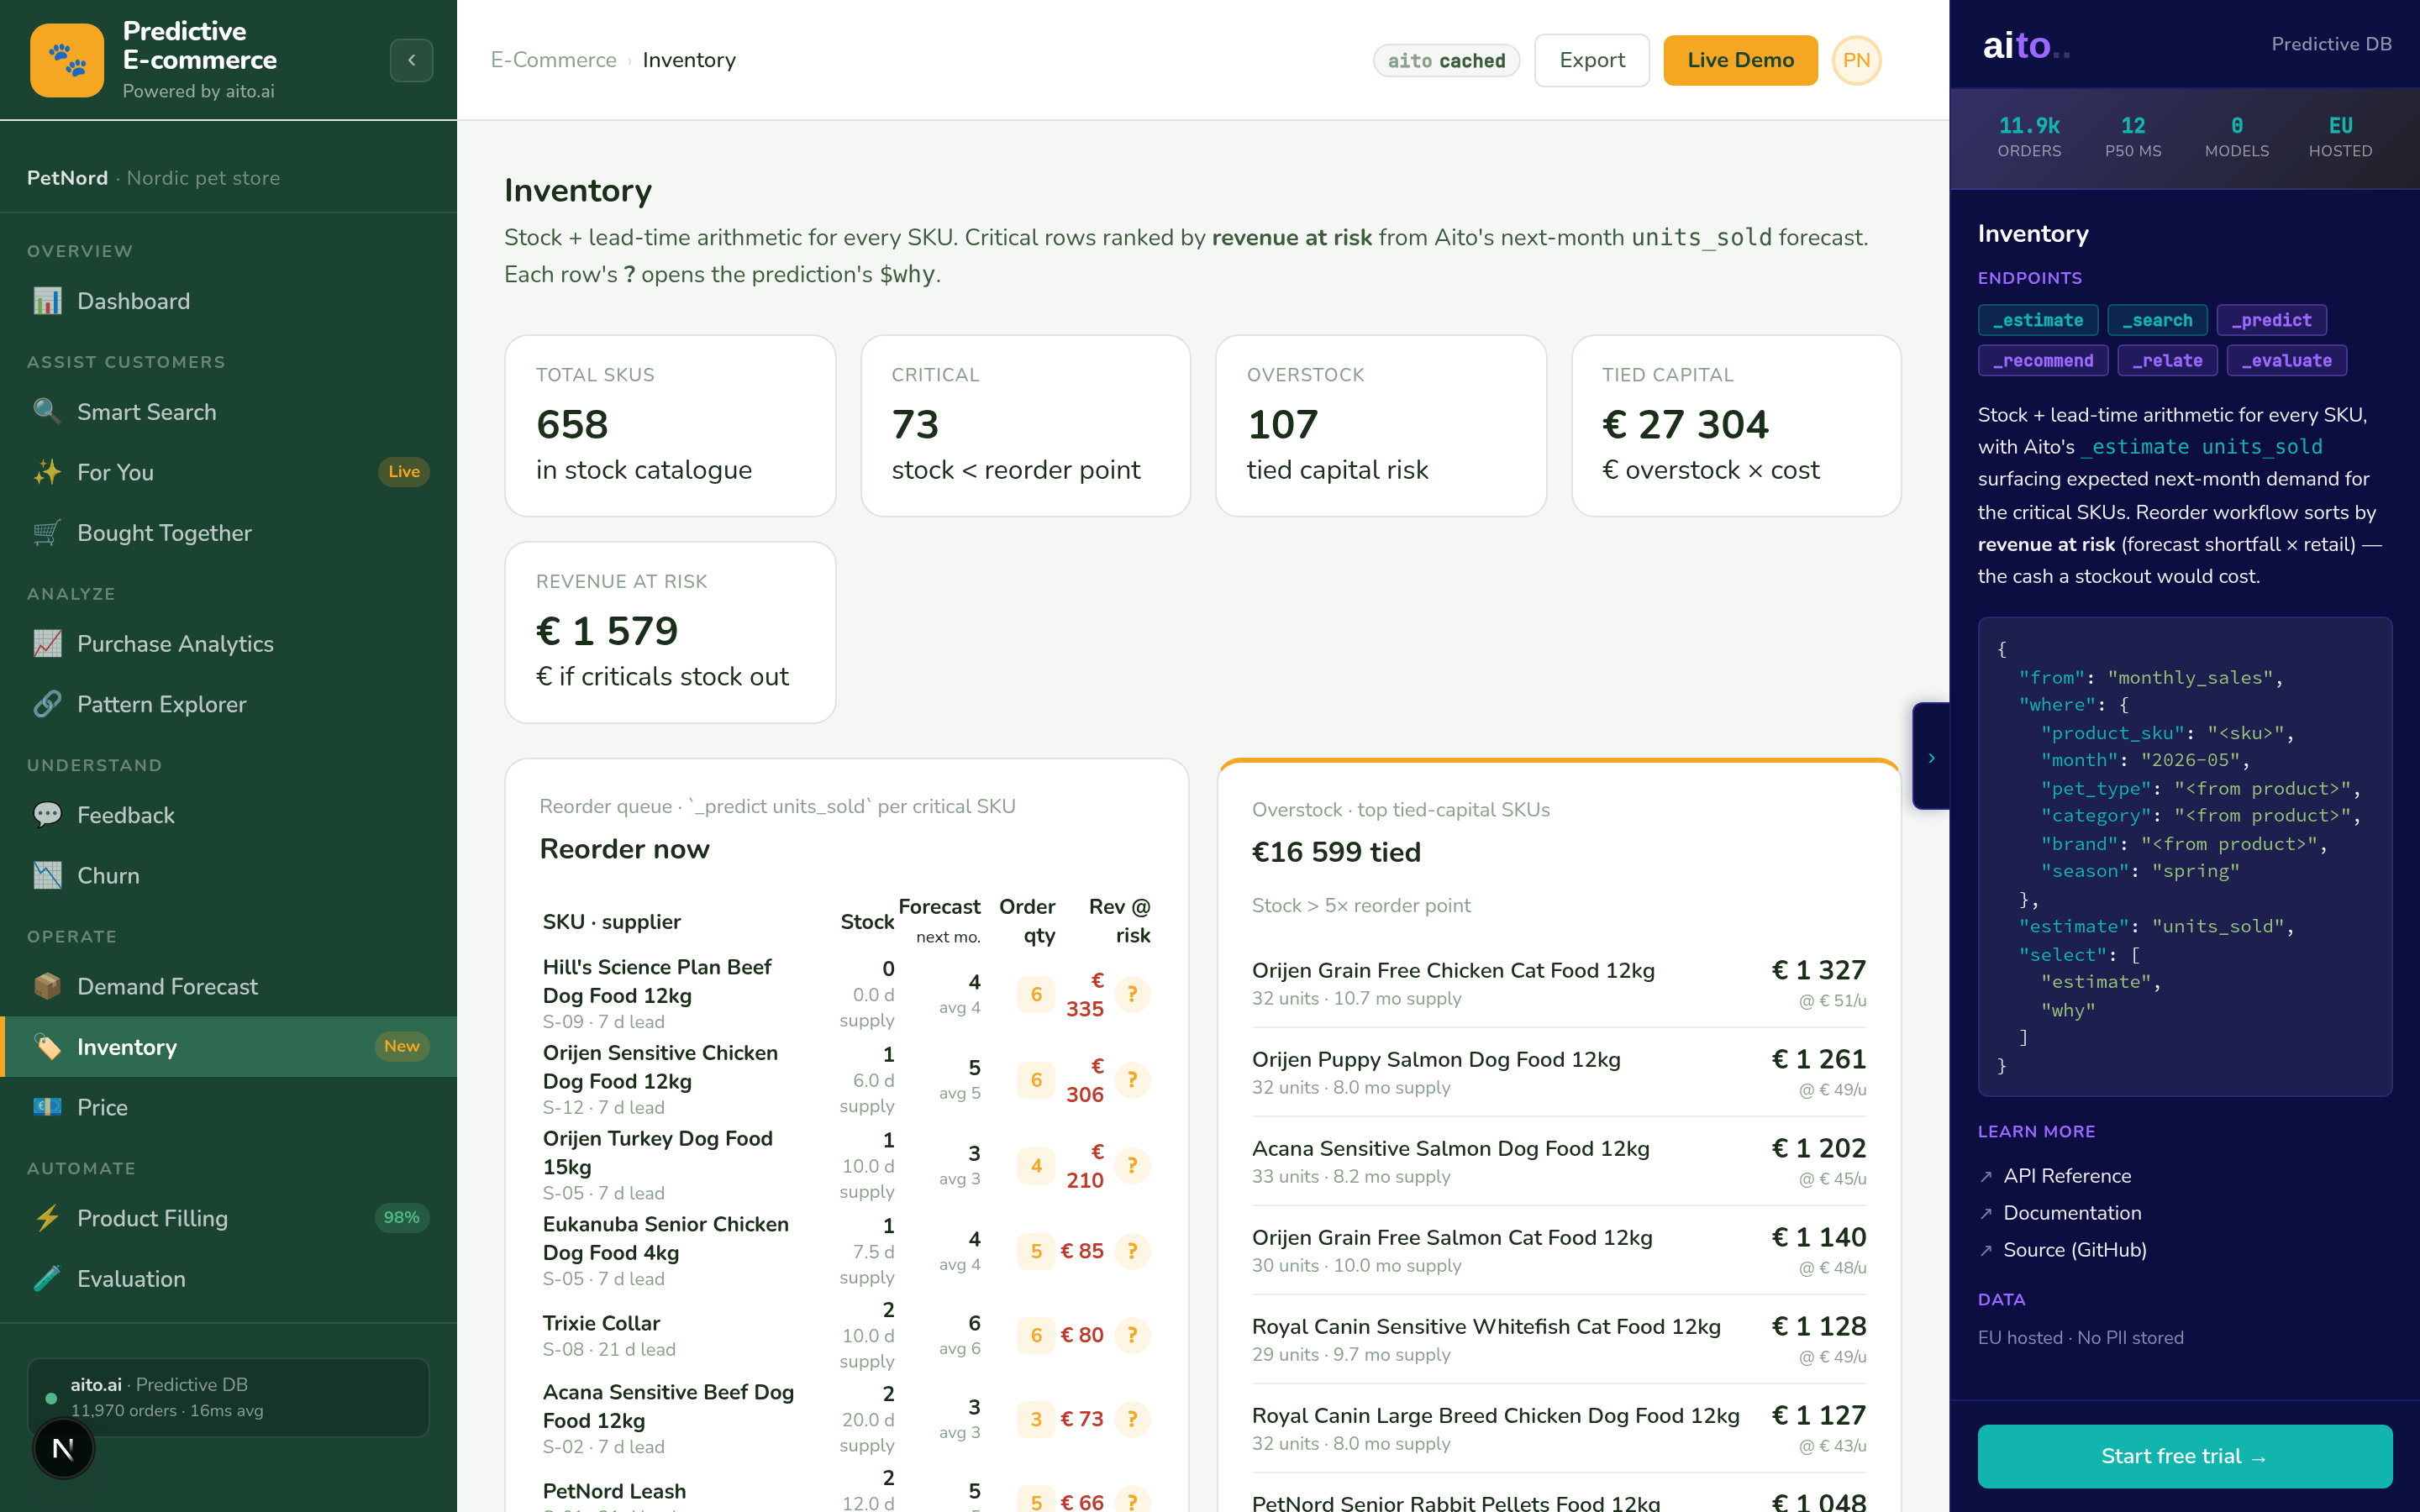
The application does the stock arithmetic (days of supply, bands against the reorder point, tied capital). The predictive database supplies the demand. In the e-commerce demo, _estimate of next month's units_sold runs for the critical SKUs, and the shortfall times the retail price is the revenue at risk that orders the reorder queue. In the ERP demo, the inventory view calls the demand forecast (_predict units_sold) for each tracked SKU.
Every forecast carries its $why, so a buyer can see why a SKU is predicted to run out before committing to an order.
For the full architecture, see the technology overview. For the broader narrative across multiple use cases, read The Predictive Application.
See it live
This use case runs in the 🛒 E-commerce demo today. Click through to the live application and inspect the queries that produce the result.