The problem
Anomaly detection in business systems is usually solved with hand-authored rules. "Flag invoices above €10,000." "Flag any vendor without a PO." "Flag amounts that deviate more than 2σ from the supplier's mean." The rules are honest, they are auditable, and they catch a portion of the real anomalies — but they also flag a lot of false positives, and they miss the cases where the surface fields look fine but the combination is wrong.
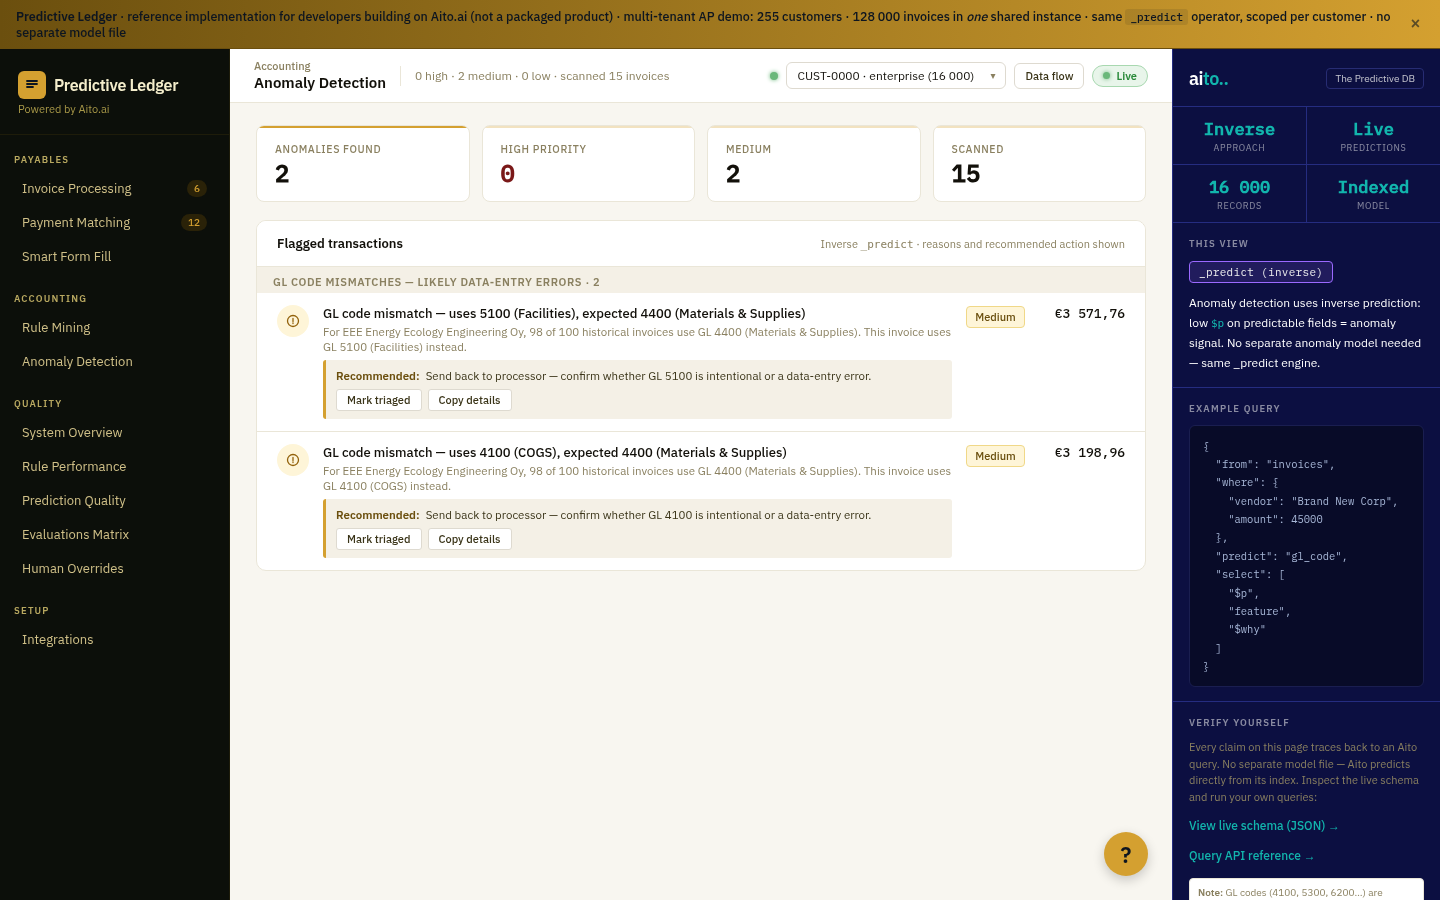
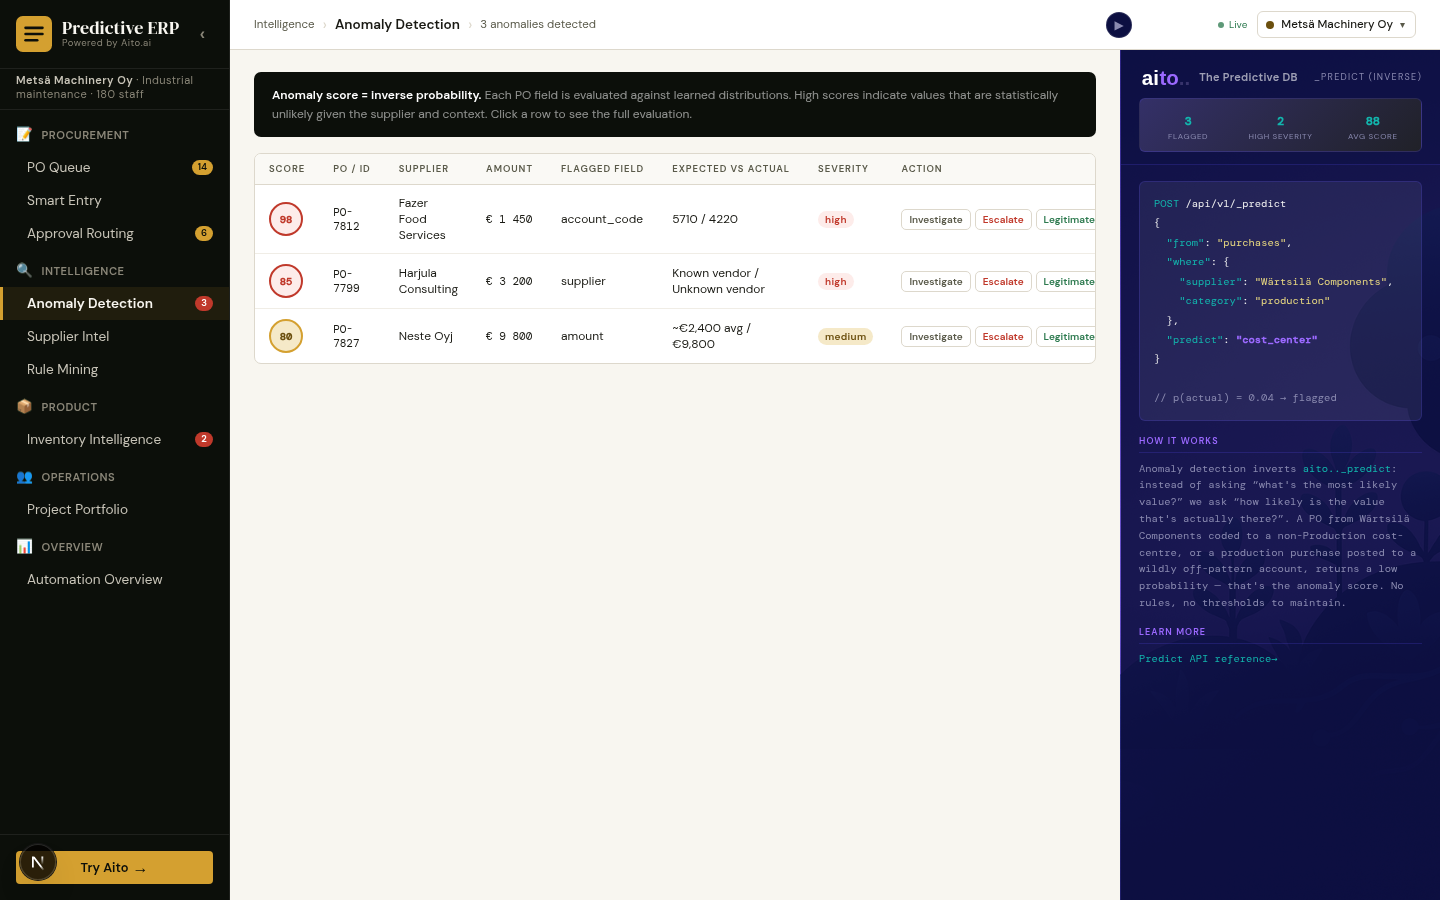
The combination is where the anomalies actually live. A €1,200 invoice from a stationery vendor is normal; a €1,200 invoice from a stationery vendor coded to the IT-infrastructure GL account is not. The amount is unremarkable; the vendor is unremarkable; the combination is the anomaly. Rules do not catch this because rules look at one field at a time.
The predictive system catches it because the predictive system knows what to expect from the combination. If the actual posting does not fall inside the predicted top-3 at >85% confidence, it is not just unusual — it is contradictory.
How it works
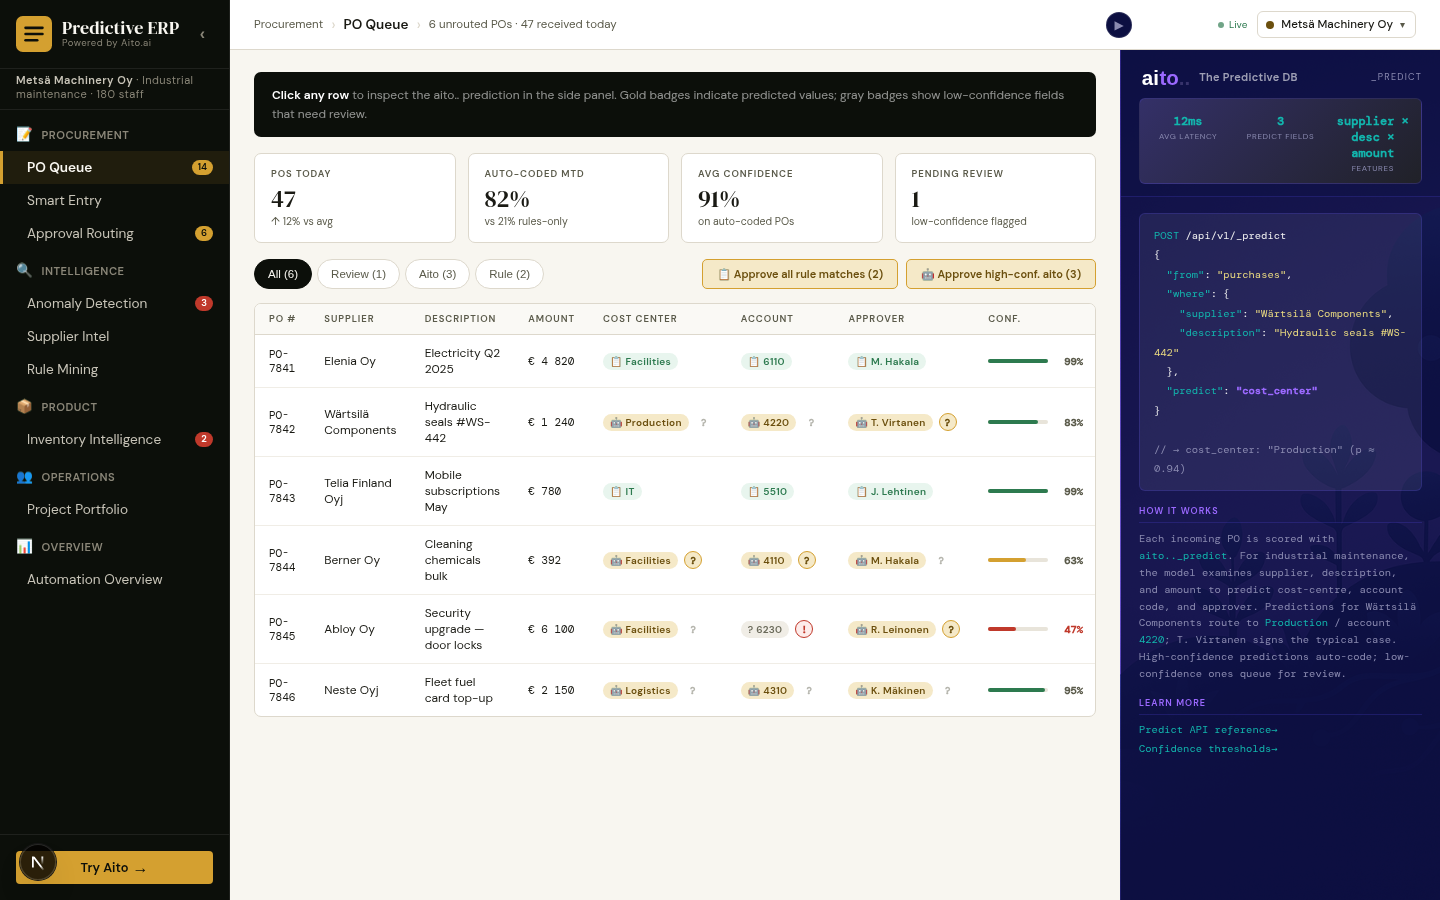
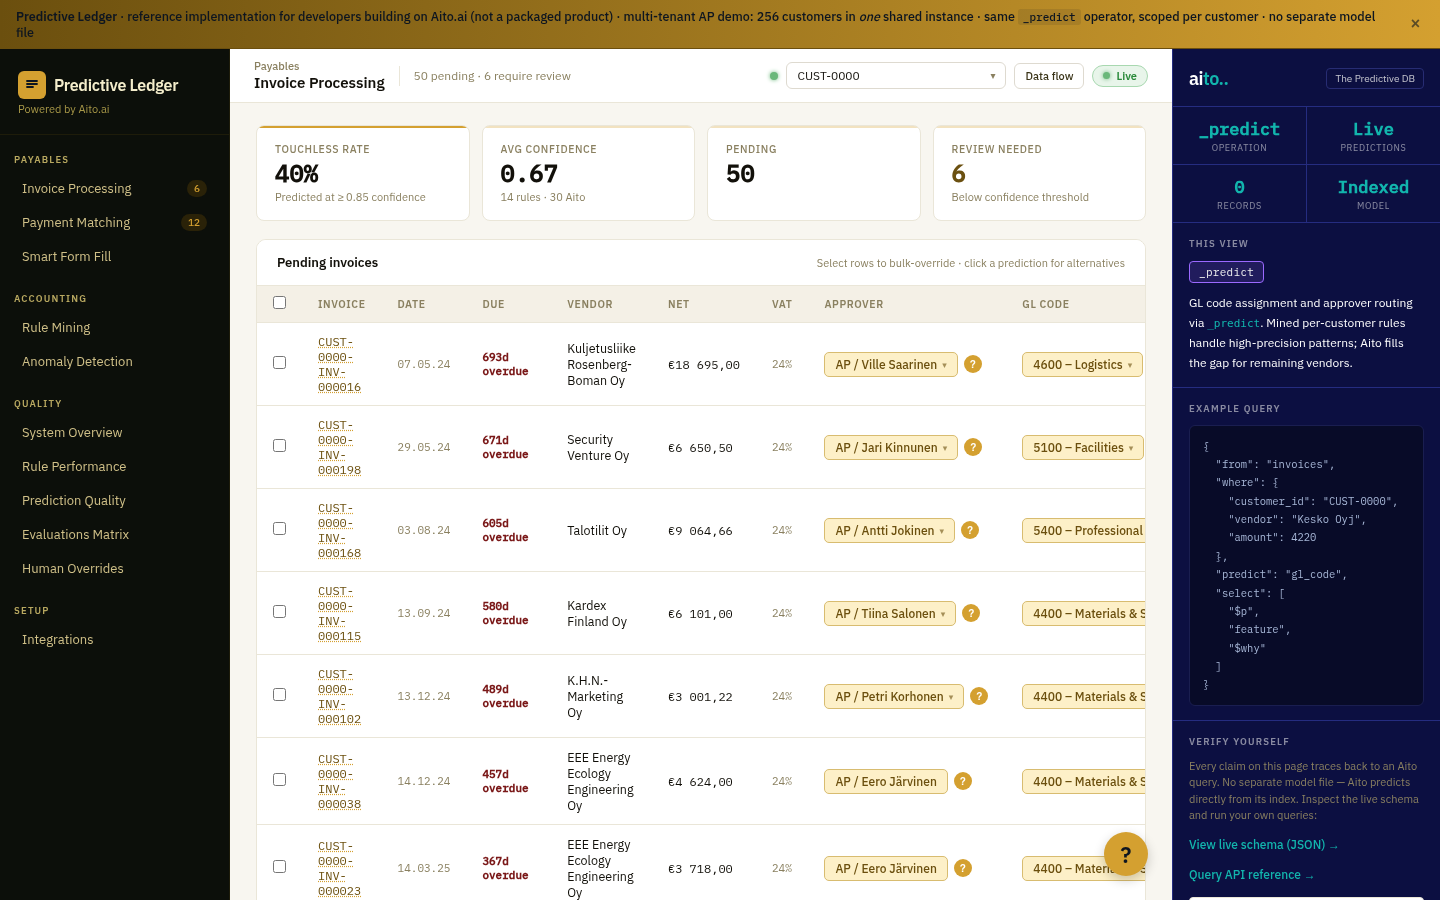
Inverse prediction is the simplest anomaly pattern in Aito. The system predicts what a normally-coded transaction should look like given its surrounding fields. The actual posted value is then compared to the predicted top-N alternatives. If the actual value matches the top-1 prediction, the row is normal. If it falls inside the top-3, it is plausible but worth a glance. If it falls outside top-3 at high confidence on the top-1, it is an anomaly worth flagging.
The same query that drives auto-routing on a forward prediction drives anomaly detection on a backward check. No separate anomaly model; the same _predict is read in two directions. The system runs the check at posting time, before the entry is committed, so the anomaly is caught while it is still cheap to fix.
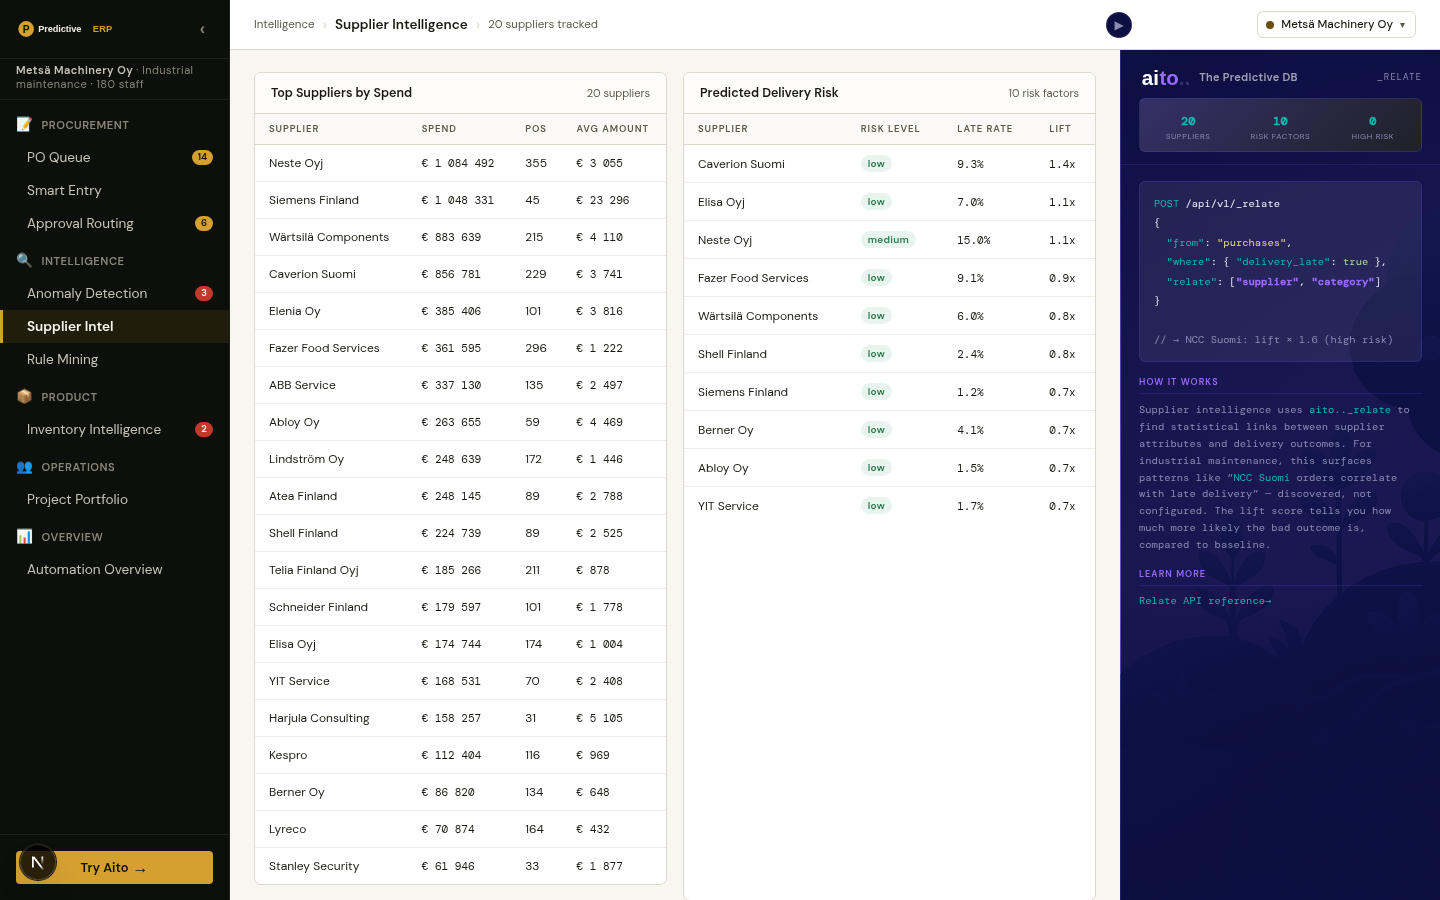
Three anomaly subtypes naturally fall out of this pattern: mis-coded (the actual GL, cost-center, or approver is not in the predicted top-3), amount-spike (the actual amount falls far outside the predicted distribution for the supplier × category combination), and unknown-vendor (no prior history exists, prediction returns very low confidence). All three surface from the same operator, the same query, the same calibration.
{
  "from": "invoices",
  "where": {
    "vendor": "Telia Finland Oyj",
    "category": "telecom",
    "amount": 1856.30
  },
  "predict": "gl_code",
  "select": ["$p", "$why", "gl_code"],
  "limit": 5
}

// Compare the actual gl_code against this top-5. If it is
// absent and the top-1 confidence is >85%, flag as anomaly.
For the full architecture, see the technology overview. For the broader narrative across multiple use cases, read The Predictive Application.
See it live
This use case runs in the 📋 ERP · 🧾 Accounting demo today. Click through to the live application and inspect the queries that produce the result. Source is on GitHub under Apache 2.0.
Frequently asked
How does this compare to rule-based anomaly detection?
Rules catch a portion of real anomalies and create a lot of false positives. Inverse prediction catches what rules miss: anomalies in the combination of fields. The system is not predicting "what is unusual" — it is predicting "what should be normal here," then flagging when the actual value contradicts the prediction. The two are complementary; mature deployments run both.
How accurate is anomaly detection on first-time vendors?
First-time vendors (or first-time combinations) return low prediction confidence — the system correctly says "no prediction yet" rather than guessing. Those rows route to manual review via the unknown-vendor subtype rather than being mis-flagged as anomalous. Mature deployments rarely auto-flag a first-time vendor as an anomaly; they route it to a clerk to confirm.
What is the false-positive rate?
At >85% top-1 confidence and actual value outside top-3, the false-positive rate sits in the 2-5% range on regular operational data. The remaining 95%+ of flagged anomalies are either genuine errors, documented exceptions, or process changes that warrant a brief review.
Can the system explain why something was flagged?
Yes. Every prediction returns $why showing the base probability and per-feature lift factors. The anomaly report shows the predicted top-3 alongside the actual value, plus the lift factors that drove the prediction — the reviewer sees in one glance why the actual did not match.
Does this work for non-financial anomalies (HR, support tickets, fraud detection)?
Yes. Any domain where a "normal" outcome is statistically determined by surrounding fields supports inverse prediction. HR onboarding fields, support-ticket routing, project staffing, fraud signals — all run the same anomaly pattern. The threshold tuning differs per domain but the mechanism is the same.