Value, quality, or growth: who was right?

Antti Rauhala
Co-founder
July 14, 2026 • 15 min read
The question
I was taught the efficient market hypothesis as gospel. Prices already reflect everything known, so nobody can beat the market for long, so a rational person just buys the index and stops trying. It is a clean theory and it is mostly good advice.
It has also never quite matched what I saw. A handful of investors have beaten the market for decades, and not quietly. Benjamin Graham did it. Warren Buffett did it, and in 1984 he wrote an essay, "The Superinvestors of Graham-and-Doddsville," arguing that his cluster of value investors beating the market for decades was too consistent to be luck. Joel Greenblatt wrote a whole book called "The Little Book That Beat the Market" with a ranked, mechanical formula and a backtest to match. The theory says this should not happen. The record says it did.
So the honest question is not "is the market efficient." It is: can you actually earn long-term alpha, and if you can, whose philosophy is right? I am a value investor, so instead of arguing about it, I built a test.
Three investors, three bets
The debate has three classic poles, and it is cleanest to give each one a name.
Graham, value. Buy things that are statistically cheap and demand a margin of safety. The bet is on price. A cheap enough asset does not have to be wonderful to make you money.
Buffett, quality. Buy a wonderful business at a fair price and let it compound. The bet is on the business: a durable moat, honest and able management, disciplined capital allocation. Price still matters, but quality is what carries the decade.
Fisher, growth. Philip Fisher, whose "Common Stocks and Uncommon Profits" shaped a generation, bet on companies with long runways of growth and a genuine secular tailwind. The bet is on the future getting bigger. Buffett himself once said he is "85% Benjamin Graham and 15% Phil Fisher," which tells you these poles are rivals and ingredients at the same time.
My own prior was Buffett's. I believed a fair-priced quality business steamrolls a cheap low-quality one over ten years, because compounding is exponential and a bad business stays a bad business. I wanted to see it in the numbers.
The setup
Take the S&P 500 as it actually stood in 2014, 2017, and 2020, reconstructed from the historical index so there is no survivorship bias. For each company, read its 10-K and proxy from that year and grade it on the qualitative factors an analyst cares about: moat, market position, market quality, leadership, capital allocation. Add the quantitative buckets: valuation, growth, leverage, profitability, momentum, volatility. Each philosophy is now a family of features. Graham owns valuation. Buffett owns the quality grades. Fisher owns growth and secular sectors.
The grading is done by an LLM reading the filings alone, instructed to use no knowledge from after the date being judged. Then every graded company goes into Aito, a predictive database, and the question becomes a query.
{
  "from": "companies",
  "where": {
    "moat_strength": "wide",
    "valuation_bucket": "fair",
    "growth_bucket": "high",
    "sector": "Information Technology"
  },
  "predict": "outcome_bucket"
}
There is no training step. The answer comes back as a calibrated probability across five outcome buckets, great to disaster, with a breakdown of which factors moved it. That breakdown is what lets us referee the three philosophies at all.
The numbers, first the ranking
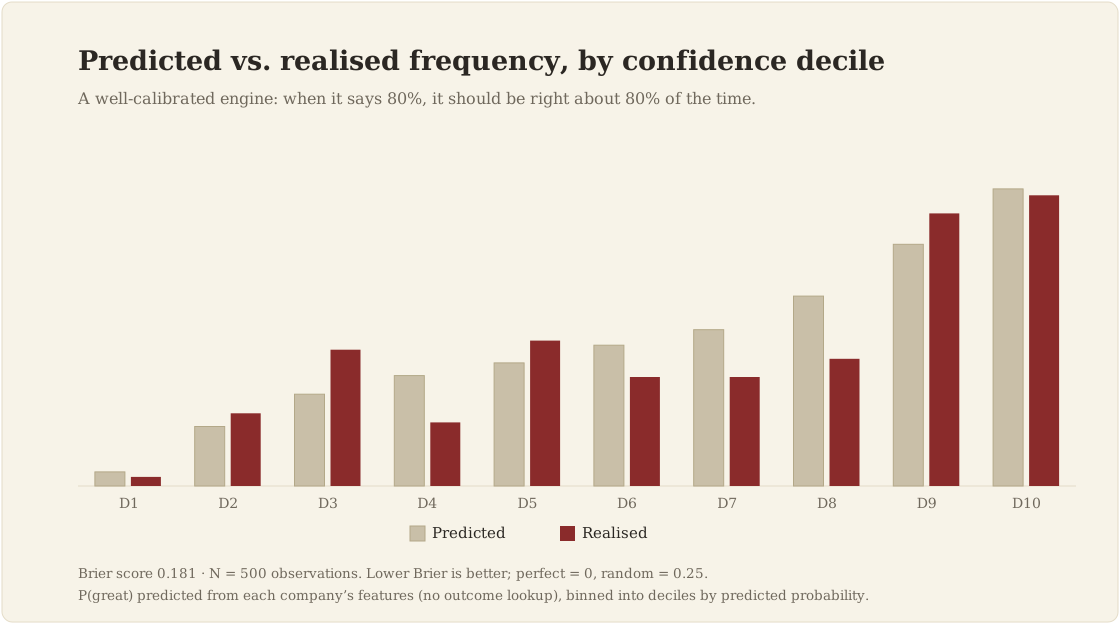
Start with the accuracy, because it is humbling. On 1,294 held-out observations, cross-validated with companies grouped by ticker so none is ever trained on its own outcome, the model gets the exact bucket right about 35% of the time, against a 27% base rate. A real lift, but a modest one. This is not a machine that tells you precisely how a company will do.
Now the fact that matters. Rank every company by expected outcome, form a top-20 and a bottom-20 fund, and measure their actual returns over the following decade:
- The market returned 7.9% a year.
- The top-20 fund returned 20.6% a year.
- The bottom-20 fund lost money, at minus 4.1% a year.
A model only a third accurate at the label still separated winners from losers by roughly 25 points of annual return. The value is in the ordering, not the precise call. Which is the whole point of calibrated prediction: you do not need high accuracy, you need an honest ranking and a model that knows when it is guessing.
So who was right?
Point the database at itself and ask which factors actually associate with a great outcome. Aito's relate query returns a lift per feature: how much more or less likely a great outcome becomes when it is present.
{
  "from": "companies",
  "relate": { "outcome_bucket": "great" }
}
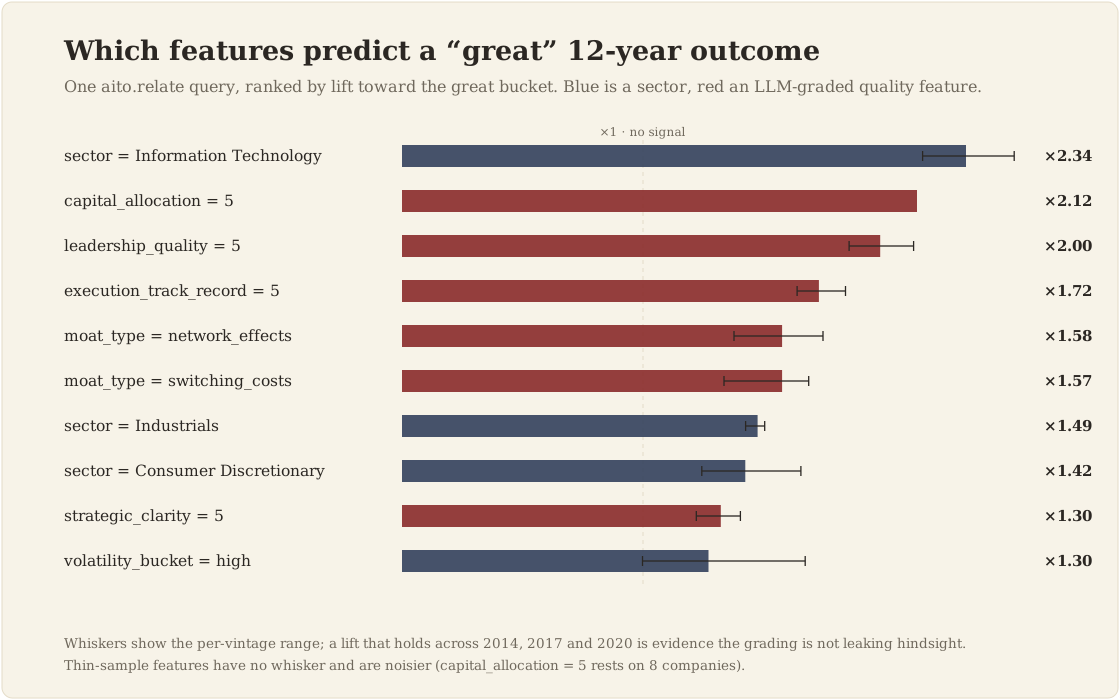
Read by philosophy, the answer is not a tie, and it is not the one I wanted.
Fisher, growth, won the decade. By a distance. The strongest factors are secular sectors: semiconductors lifted the odds of a great outcome 3.0x, technology hardware 2.8x, Information Technology as a whole 2.3x. This is the megatrend showing up as data. Most of the realized return came from being in the sectors the age was building. As a value investor, that stings, and the data earns the sting.
Buffett, quality, was the survival engine. Independent of sector, the quality grades carry real signal, and the shape of it is the point. High leadership quality lifted great outcomes 2.0x, wide moats 1.3x, but these factors barely raise the ceiling and strongly protect the floor: a wide moat cuts the odds of a poor or disastrous outcome to a third, and the single clearest disaster signal in the whole dataset was bad capital allocation, which raised the odds of a poor outcome nearly 4x. That asymmetry is the stronger result, and it is easy to undervalue. A position that falls 50% must double just to break even, and one real disaster stops compounding entirely. The bottom-20 fund did not merely lag, it lost money for a decade while the market more than doubled. Avoiding that is where long-term returns actually come from. Rule one, do not lose money, because rule two depends on it.
Graham, value, was the smallest signal and the most trustworthy. Cheap gave a modest 1.2x lift and reduced downside; expensive did the reverse. Small, but it is the one signal with no way to fool itself, for reasons I will get to. And one result that will annoy the purists: brand moats, the classic Buffett fortress, actually underperformed in this window, while switching-cost and network-effect moats won.
So the verdict, honestly. In this era the growth pole won outright. But the decomposition shows why nobody was really wrong. Growth supplied the upside, and it is the least repeatable part. Quality supplied survival, which is what lets any of it compound. Value supplied price discipline, which looks small here and becomes decisive exactly when you are overpaying. The strategy that actually won was the synthesis, a quality growth business bought at a fair price, which is precisely Buffett as 85% Graham and 15% Fisher. The era simply paid the growth ingredient the most.
Where do I land, as someone who came in a value believer? I have moved. I now think you have to respect the megatrend of the age more than my instincts wanted to admit. With one large asterisk, which is the price you pay for it.
The disclaimers, because a backtest lies if you let it
Every figure above is honest within its frame. The frame has limits, and the limits matter more than the numbers.
Small and long. Around 250 companies per vintage, twelve-year outcomes, no transaction costs, no capacity. A hypothesis test, not a trading system.
Reverse causality on the quality grades. A company already winning at the time of its filing tends to read as well managed, so an LLM leadership grade may partly measure past success rather than predict future success. This is why I trust the mechanical valuation signal, which has no such loop, more than the leadership grade. To probe it, the demo measures each factor's lift separately within each vintage and checks whether it drifts over time. It does not drift much, which is what you want if the grading is genuinely reading period filings. That rules out one kind of leakage, not the contemporaneous halo.
More features made it worse. A chosen six features beat all sixteen, and the reason is not the obvious one. It is not redundancy. The engine is good at that, collapsing overlapping grades so a thing measured four ways is not counted four times. The problem was noise. Every feature you add carries a little signal and a little noise, and past the useful handful the noise wins, so the extra grades subtracted accuracy rather than adding it. The lesson is that feature selection matters more than feature count, which is easy to forget when adding a column costs nothing.
And the deepest one: the future's winning sector is sitting in the training data. Cross-validation stops a single stock from leaking its own outcome. It does nothing about the whole sample sharing one macro regime. Every vintage here, 2014 to 2026, lived in an era led by technology and semiconductors, so the model learned that "sector = Information Technology" is a strong signal. But an investor standing in 2010, watching Intel's dominance fade, had no way to know that 2020 would again belong to semiconductors, this time through AI. The winning sector of the future is visible to the model in the realized outcomes and invisible to anyone actually making the decision at the time. That is the true limit of any backtest. It tells you what would have worked, not what you could have known. It is also why the value signal looks so small here: not one of these three vintages was a moment of badly overpaying, so the sample never tests the decade where price is everything.
The four schools, actually run
Saying growth won is not the same as saying you could have run it. So I built four funds, each ranked by the same engine on the same held-out data, and changed only which features the model was allowed to see: value features, quality features, growth features, or all of them. Then I bought the top names and measured what they actually returned.
| School | Top 20 | Top 100 | Give-back (20 to 100) |
|---|---|---|---|
| Growth (Fisher) | 31.1% | 21.4% | −9.6 |
| Value (Graham) | 24.8% | 12.4% | −12.4 |
| Composite (all of it) | 19.5% | 17.7% | −1.7 |
| Quality (Buffett) | 18.0% | 14.0% | −3.9 |
| Market | 7.9% | — | — |
The top-20 column is a trap, and reading only it is how people fool themselves. Growth's 31% is real, and it is the semiconductor cluster again: AMD, Microchip, Skyworks, Broadcom. But it is a hindsight trophy. To have earned it you had to know, in 2015, that chips would own the next decade. Value's 24.8% is partly a mirage, a concentrated cheap-stock bet that the engine's own robustness check marks down into the mid-teens, and it gives back more than any other school the moment you hold more than twenty names.
Read the last column instead. It asks what happens when you widen from a lucky twenty to a hundred, which is what a real portfolio looks like. Growth hands back ten points, value twelve. The composite hands back less than two. At a hundred names it is second only to the hindsight megatrend and beats every school you could have picked in advance. Its edge was never a lucky top slice. It was breadth, and breadth is the only thing here you could have run without a crystal ball. (The composite is the same all-features model as the "Beat the Market" view earlier; 19.5% is its deterministic mirror, 20.6% the live engine.)
Why growth wears a "do not try at home" badge
Growth has the highest ceiling on that chart, and I still would not point a normal investor at it, because it hides two bets, not one. You have to pick the right future, and you have to be willing to overpay for it before anyone else agrees.
I lived a smaller version of this. In the early 2020s a couple of friends told me the GPU makers were about to matter enormously, Nvidia most of all. They were right. I did nothing, mostly because I only ever buy index funds, and partly because the price already looked stretched, and paying it made sense only if you held a conviction about the future that I did not. In hindsight that was expensive. At the time it was the reasonable call. That is the trap of the growth school. Before the fact, the next Nvidia and an overpriced hype stock look almost alike, and what separates them is a conviction that is itself a gamble. That is venture capital, a diversified professional power-law game, and it earns its do-not-try-at-home badge.
And yet the growth school is not wrong about where the money is. The megatrends of an age really do drive most of global growth and most of investor returns. The catch is only that owning them early and concentrated is a bet most people should not place with their savings.
The quiet part is the one I actually believe. A plain index fund captures those same megatrends anyway. It does it late and diluted, but automatically: as a company earns its way into the winners it grows into the index, and you own more of it with no need to pick it or to overpay on conviction. You get the megatrend at market return, with none of the do-not-try-at-home risk. For a time-poor investor, that is the rational trade.
Why this is not really about stocks
Strip the equities away and look at the shape. We took human judgment buried in documents, turned it into structured grades with an LLM, and let a predictive database turn those grades into a calibrated, explainable forecast. No training pipeline, no model to deploy, one query that returns a probability and its reasons.
That pattern is the same in credit underwriting from filings and call notes, in M&A diligence from a data room, in supplier risk from audits, in hiring from unstructured evaluations. Anywhere expert judgment lives in text and the decision is really a prediction, this architecture applies. Equity research was just a vehicle everyone can argue about.
So who was right? All of them, and none alone. Value is real but fragile. Quality keeps you alive. Growth is where the biggest money is and the surest place to get hurt reaching for it. Each is a lens, right about part of the picture and blind to the rest. The thing that actually held up was not a school at all. It was the willingness to weigh all three at once and let the evidence set the weights, which is why the composite barely decayed while the purebreds faded. Call it the data-driven school of investing. It is less a new opinion about markets than a refusal to hold only one. A calibrated predictive database is simply the tool that makes it runnable, because it can hold value, quality, and growth on equal footing, weigh them by what actually predicted the outcome, and tell you how sure it is.
I came in a value investor who had drifted toward quality and started to suspect the growth crowd was right. I am leaving with something duller and more useful: no single doctrine survives twelve years of data, and the honest edge is breadth, calibration, and knowing what you do not know. For a passive investor with no time for the homework, that is either an argument for a good index fund or for letting a database do the weighing. I have made my peace with both.
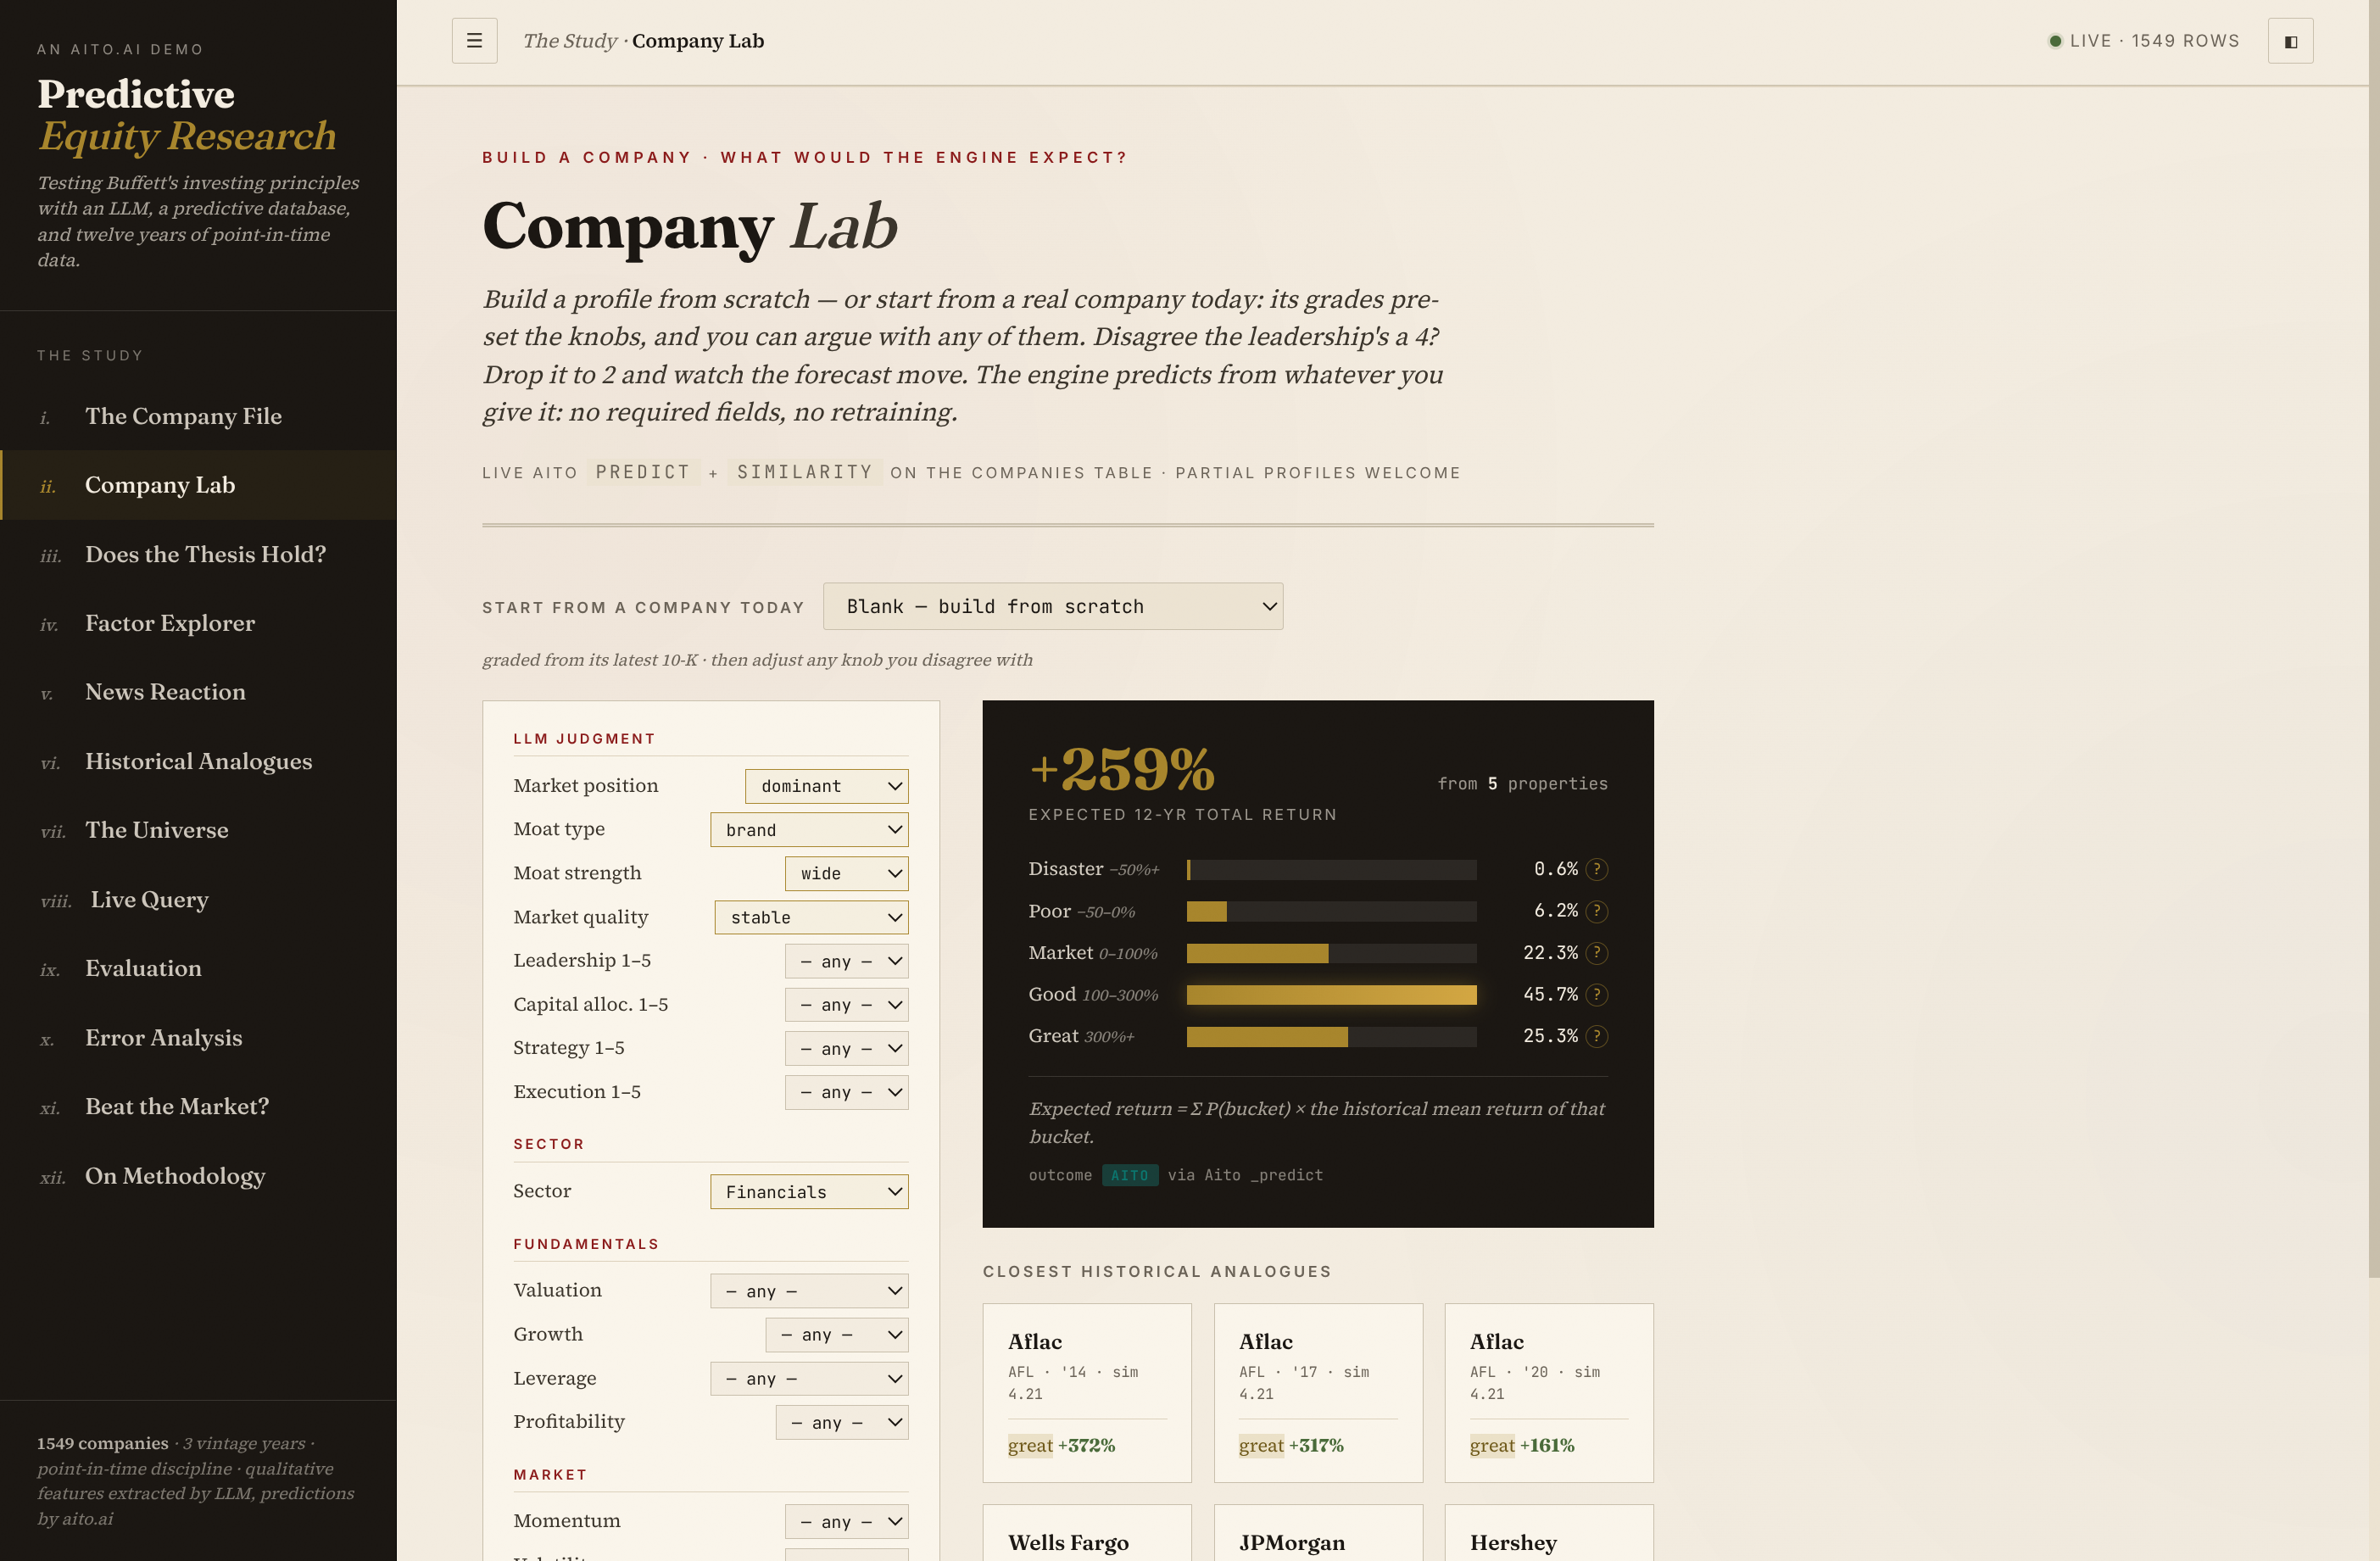
You can build a company and query the engine yourself at demos.aito.ai/equity.
Back to blog listAddress
Episto Oy
Putouskuja 6 a 2
01600 Vantaa
Finland
VAT ID FI34337429


