Evaluating intelligent automation use cases has never been this easy
Tommi Holmgren
CPO
March 19, 2021 • 8 min read
While working with RPA engineers and customers over the past year, we have seen a repetitive challenge. Experimentation takes too long and creates uncertainty. There are ideas and needs for the next intelligent automation case, but seeing if it would work takes too much effort when ML is involved. The result: good automation opportunities remain untouched.
In practice, the work entails extracting a historical dataset of what has the manual process done, defining the "prediction target", and testing with ML tools what the expected automation performance would be. AI adds complexity here, as it is far less clear and more difficult to comprehend than in the case of rule-based processes.
Aito's new Evaluation view is the fastest way to explore the viability of an intelligent automation use case with real data. It will give you concrete results like the potential automation rate, uncover the issues and show the business impact.
We have made this process extremely simple. Read on to see how!
Create an evaluation
In the Aito Console, under your instance, there is now a new tab called Evaluations (Preview). The features are functional but still under constant development. We appreciate all the feedback, as it will help us fine-tune this to suit user needs the best!
When opening the view for the first time, it is all empty, but later on, you'll find your past Evaluations here, like in the screenshot.
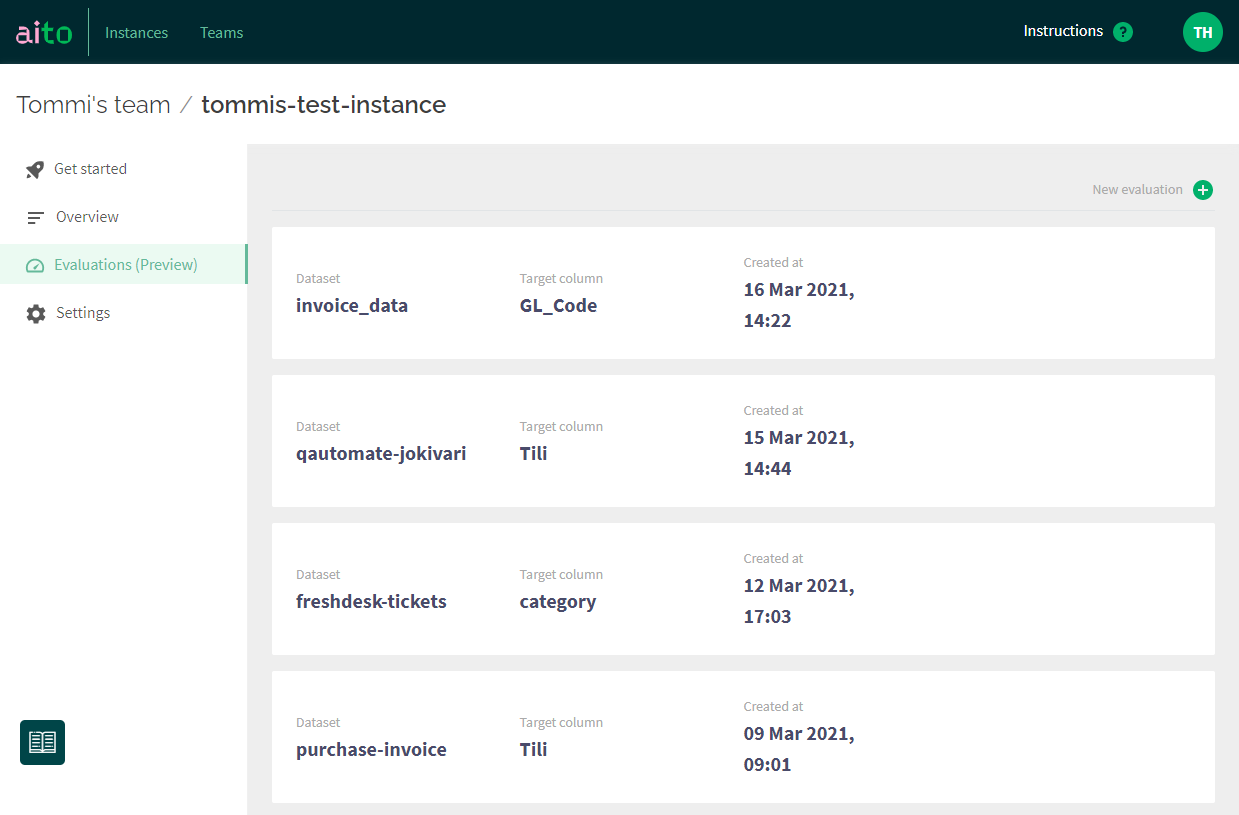
First, make sure you have uploaded a dataset to Aito. Once that's done, hitting the green + button at the right top corner of the screen opens up a view for creating a new Evaluation. Let's explore the elements in detail.
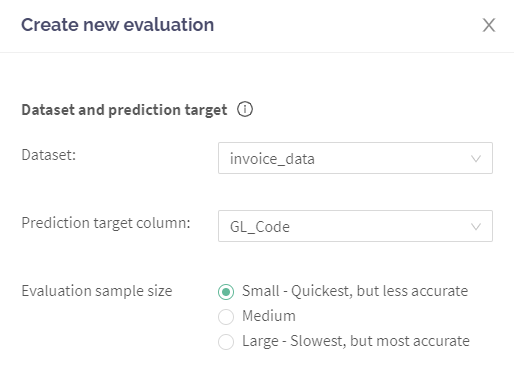
First, you'll need to choose a dataset and the prediction target. The latter means which column in your data is the one you are trying to learn and predict. For example, in the example screenshot, we look at historic purchase invoice accounting data and try to predict the correct general ledger code GL_Code for a new invoice.
You'll also have control over your priorities: do you prefer to make the Evaluation happen quick but less accurate, or slower but more accurate. This selection controls the size of the test sample that Aito uses for the Evaluation. The actual time it takes to run depends on multiple factors like your dataset's size and complexity. Based on our tests, you should get results with the "Small" option in max about 10 minutes in most cases.
Here's a link for further reading on what happens below the hood, for those who are interested!
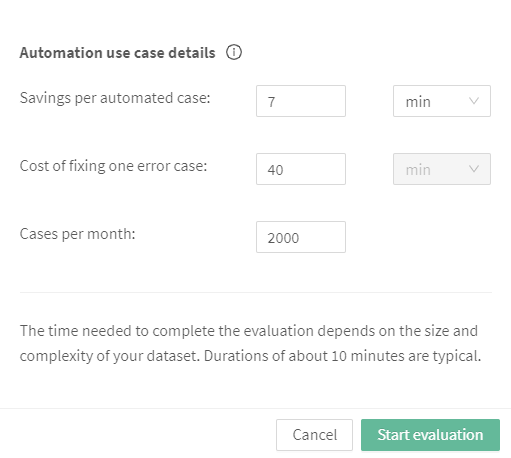
Now we are getting to something fabulous! For Aito to spit out better recommendations for you that take away the difficulty of setting parameters for AI-based decision-making, we ask you a few more questions. We use this information to seek the best balance between the highest possible automation rate while keeping the error manageable.
- Savings per automated case means the time or monetary value that describes the automation's benefit - if the prediction is correct. For example, how much time you'd save by automatically predicting the GL code for the purchase invoice and thus being able to process the invoice without human touch.
- Cost of fixing one error case is the flip side of the coin. If the automation makes a mistake (for example, files the invoice to a wrong GL code), how much time/money it takes to fix this problem.
- Cases per month means how many such decisions and cases are you making monthly.
The values are mandatory for now. Feel free to invent some numbers if you don't have the actual numbers at hand. Then, hit start. The system emails you when the Evaluation is complete, and the results are available.
What are your automation vitals?
Ready? Let's have a look at the results. The view is interactive, so feel free to open it in the meeting between RPA engineers and process owners. While we tested this with some clients during development, we got into excellent discussions that clarified the process at hand and ultimately provided better automation solutions.
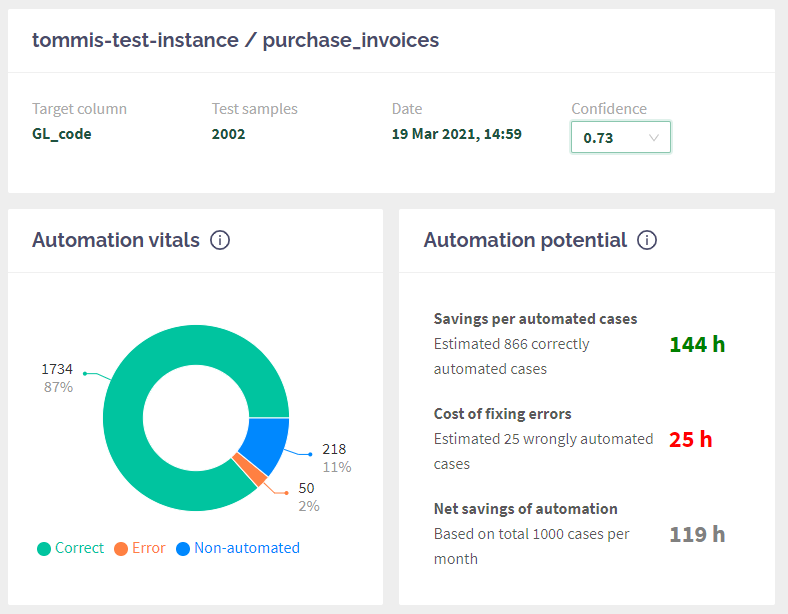
The first essential element is Confidence in the top right corner. This dropdown is used to set the desired confidence threshold and affects all the rest. By default, it reflects the threshold that maximises your net savings with automation. Go ahead and play around with the Confidence, and see how the graphs change!
The next row shows the most critical indicators for your intelligent automation use case. The pie chart displays how it would work in real life. Aito has taken aside a test sample (in my case, 2002 entries), and tried making predictions with them, and compare results to the reality and print it out in this way:
- Correct: how many of the automation decisions would have been made correct (meaning that the automation could have used the value automatically, no human review needed).
- Error: how often Aito gave the result high Confidence, but it was wrong. These are the most significant problems, as automation would have continued running with false information, causing work to fix it.
- Non-automated: these are the cases that fall below the confidence threshold and thus will require a human review before the process can complete.
Our users often look at the graph with different Confidence values to see how the error behaves. Usually, it might be better to choose higher Confidence initially, which means there are fewer errors - but also a bit lower level of automation.
On the right side, you'll have a summary of how the above metrics would look like when applied your savings and cost of errors together with monthly cases. With my sample use case, I would save 119 hours of repetitive work every month. That's 16 days worth of time for something more meaningful!
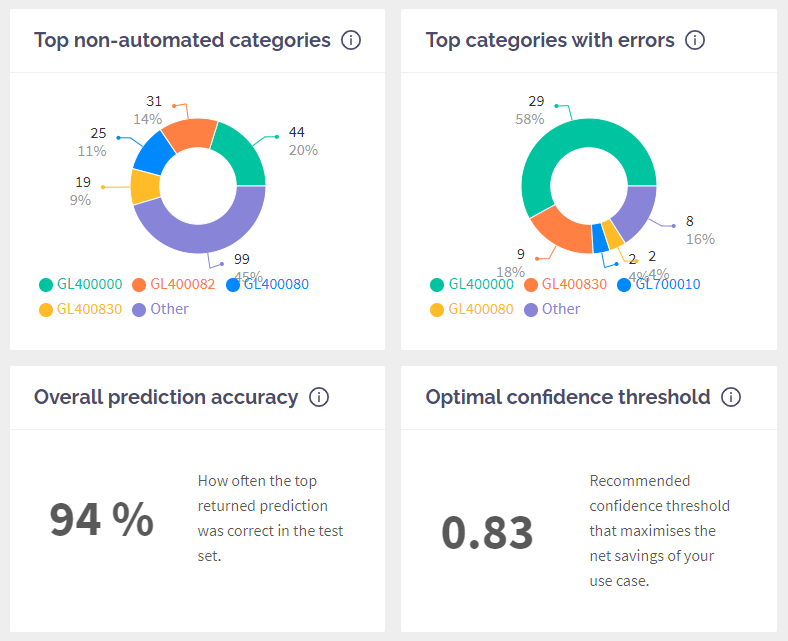
The following two charts dig deeper into your data and display which categories (or target values) were the most problematic causing the most manual review and errors. These charts help your team spot any apparent issues in the data and set the expectations right.
The last row is "FYI" kinda things showing you the overall prediction accuracy (how often the first result was correct, ignoring the confidence threshold) and also which confidence threshold produces the highest net saving according to your numbers.
Limitations and what's coming next
Releasing the Evaluation view is the first big step towards the direction we set for the company at the beginning of the year.
We are working with things big and small all the time. The primary limitations as of today are:
- You can only evaluate
_predictendpoint queries. For example,_matchand_similarityare out of the current scope. - Evaluation results view is made with exclusive predict in mind. This means that it assumes you are trying to predict a single right category (for example, a category for IT support ticket). It does not work yet with non-exclusive predict (predict multiple tags).
- Evaluation uses all the rest of the columns in your table as input columns. No way to choose only a subset for inputs.
Here's what we are working on at the moment and will get to you soon!
- UI for data upload and schema creation. We will make the initial data upload massively easier than it is now by taking away the need to tinker with schemas using the API or Python SDK.
- Possibility to define the input columns together with the prediction target. There are often cases where not all the data is available at the prediction time, so we will give you control to try the evaluations with only a subset of input columns.
- UI for testing Aito queries and exploring the responses in a visual format. We will bridge the gap between experimentation (done with the evaluation view) and integration (putting the predictions into work in the RPA workflow).
- Loads and loads of tweaking of the UI (like make the confidence threshold selection more intuitive than the current dropdown), and "small things" that are lacking (like deleting old evaluations).
As always, please be in touch and tell us what you think!
Back to blog listAddress
Episto Oy
Putouskuja 6 a 2
01600 Vantaa
Finland
VAT ID FI34337429


